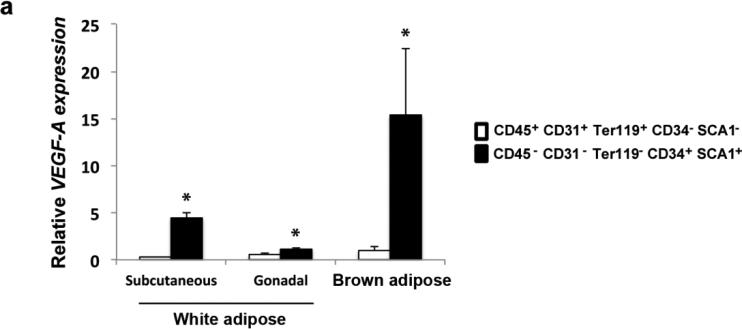
Figure 1.
VEGF-A expression in sorted SVF cell populations from WAT and BAT. Expression levels of VEGF-A were measured by qRT-PCR in lineage specific cell populations, representing hematopoietic and myeloid progenitors (CD45+ CD31+ Ter119+ CD34− SCA1−), as well as adipocyte precursors (CD45− CD31− Ter119− CD34+ SCA1+). Stromal vascular cells were isolated and sorted from WAT and BAT from male wild type mice. Results are representative of 3 separate experiments pooling three mice each for WAT, and two mice each for BAT. Data are means ± SEM. *p <0.05 compared to CD45+ CD31+ Ter119+ CD34− SCA1− cells.

