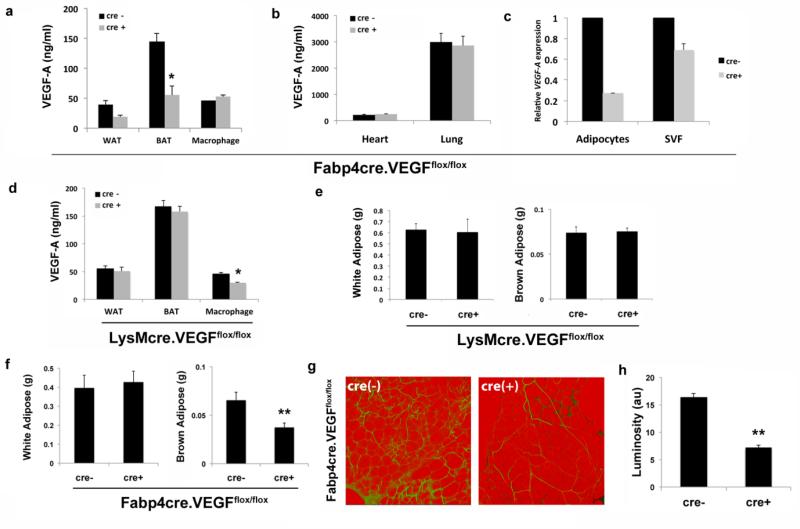
Figure 2.
Tissue-specific ablation of VEGF-A. VEGF-A protein expression in a) WAT, BAT, macrophages, b) heart and lung from Fabp4-cre(−).VEGFflox/flox and Fabp4-cre(+).VEGFflox/flox mice quantified by ELISA. c) mRNA expression levels of VEGF-A in adipocyte and stromal vascular fraction (SVF) from BAT of Fabp4-cre(−).VEGFflox/flox and Fabp4-cre(+).VEGFflox/flox mice. d) VEGF-A protein expression in WAT, BAT, and peritoneal macrophages from LysM-cre(−).VEGFflox/flox and LysM-cre(+).VEGFflox/flox mice quantified by ELISA. e) Epididymal fat pad (WAT) and interscapular brown adipose (BAT) weights were measured in male LysM-cre(−).VEGFflox/flox and LysM-cre(+).VEGFflox/flox mice. f) Epididymal fat pad (WAT) and interscapular brown adipose (BAT) weights were measured in male Fabp4-cre(−).VEGFflox/flox and Fabp4-cre(+).VEGFflox/flox mice. g) Representative confocal micrographs and h) quantification of vascularization in epididymal fat pads stained with BS1-lectin (FITC) for vasculature and BODIPY (Texas Red) for adipocytes. Vascularity is expressed as arbitrary units of luminosity (au). (Fabp4Cre(−) mice, n=15; Fabp4Cre(+) mice, n=13; LysMcre (−) mice, n=11; LysMcre (+) mice, n=13;). *p <0.01; **p <0.002

