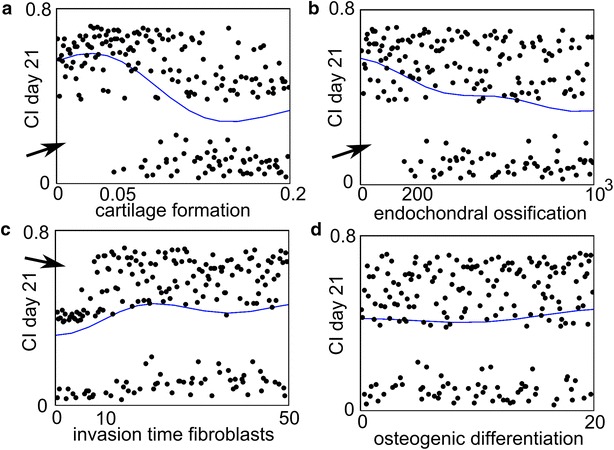
Fig. 6.

Results of the sensitivity analysis of the NF1 model. The horizontal axis shows the value of the parameter and the vertical axis shows the value of the complication index (CI) on Day 21. The CI value assess the degree of severity of CPT and is an averaged value of the amount of fibrous tissue, fibroblasts and bony union. A parameter combination for which the value of CI is small, is one for which the degree of severity of CPT is small (the fracture healing proceeds fairly normally). The dots indicate the actual results obtained from the computational model (each dot represents the CI response obtained for a particular combination of parameter values of the NF1 model), and the solid line indicates the statistical prediction by a Gaussian process. Note that the actual results (the dots) split up in two classes: one for which the CI value is high, resulting in impaired bone healing and one for which the CI value is low. In case (d), the dots are present in both classes, regardless of the parameter values. In cases a, b, parameter values below 0.05 and 200 respectively, always lead to a high CI value (indicated by the arrow), whereas in case (c) parameter values below 10 result in low to intermediate CI values (indicated by the arrow) (adapted from [50], licensed under CC BY 4.0)
