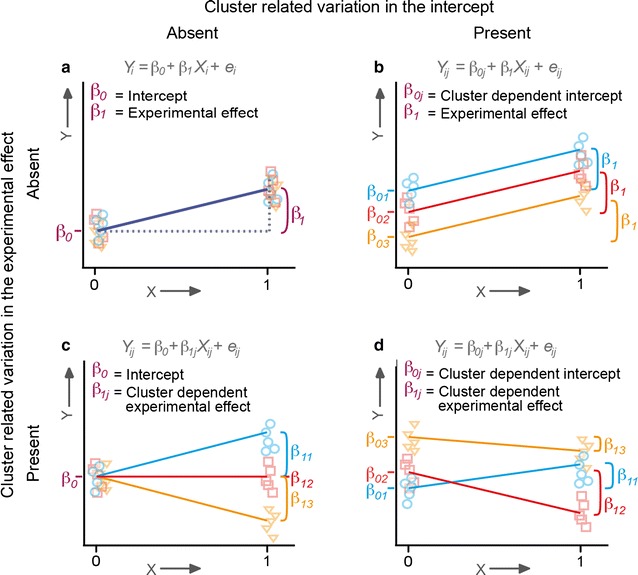
Fig. 2.

Graphical representations of variants of research design B data. Different possible combinations of cluster-related variation in the mean value of the control condition (i.e., the intercept; ) and cluster-related variation in the experimental effect (), illustrated for 3 clusters of data: no cluster-related variation (a), only cluster-related variation in the intercept (b), only cluster-related variation in the experimental effect (c), or cluster-related variation in both the intercept and the experimental effect (d)
