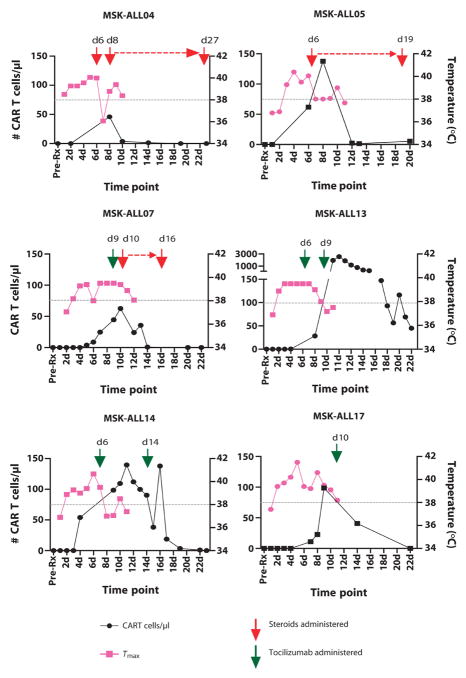
Fig. 2. The effect of steroids and/or tocilizumab on the expansion of CAR T cells in patients with sCRS.
The number of CAR T cells per microliter of whole blood, detected by qPCR, was measured in samples drawn before treatment and from days 1 to 22 after CAR T cell infusion. Max temperatures on days 1 to 11 are also depicted. In addition, the days when steroids or tocilizumab was administered to manage sCRS are shown. The red dashed line represents the duration of steroid treatment, and the gray dashed line is at the 38°C fever threshold.

