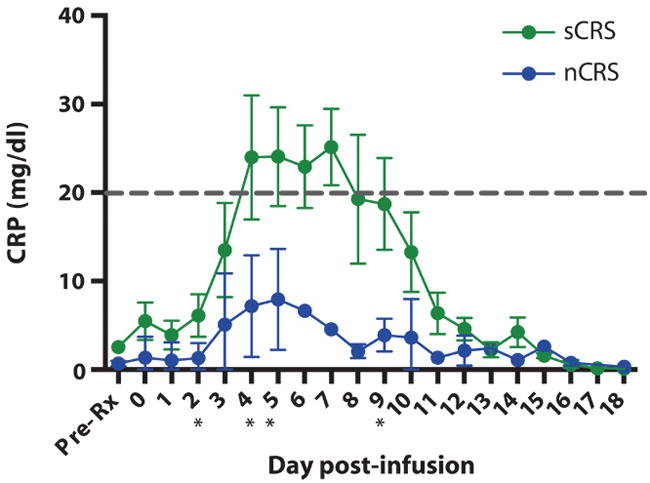
Fig. 4. CRP levels in patients infused with 19-28z CAR T cells.

CRP was measured before treatment and from days 1 to 18 after CAR T cell infusion. The green lines represent CRP levels from patients who met the diagnostic criteria for sCRS (n = 4) and were treated with either tocilizumab or nothing. The CRP levels of patients classified as nCRS are illustrated in blue. Error bars are the SEM. The gray dashed line is at 20 mg/dl, which indicates the threshold where patients are at high risk for clinical complications secondary to sCRS. *P < 0.05, unpaired t tests at the corresponding time point. Specific P values for the time points are as follows: day 2, P = 0.035 (n = 13); day 4, P = 0.025 (n = 12); day 5, P = 0.019 (n = 11); and day 9, P = 0.01 (n = 8).
