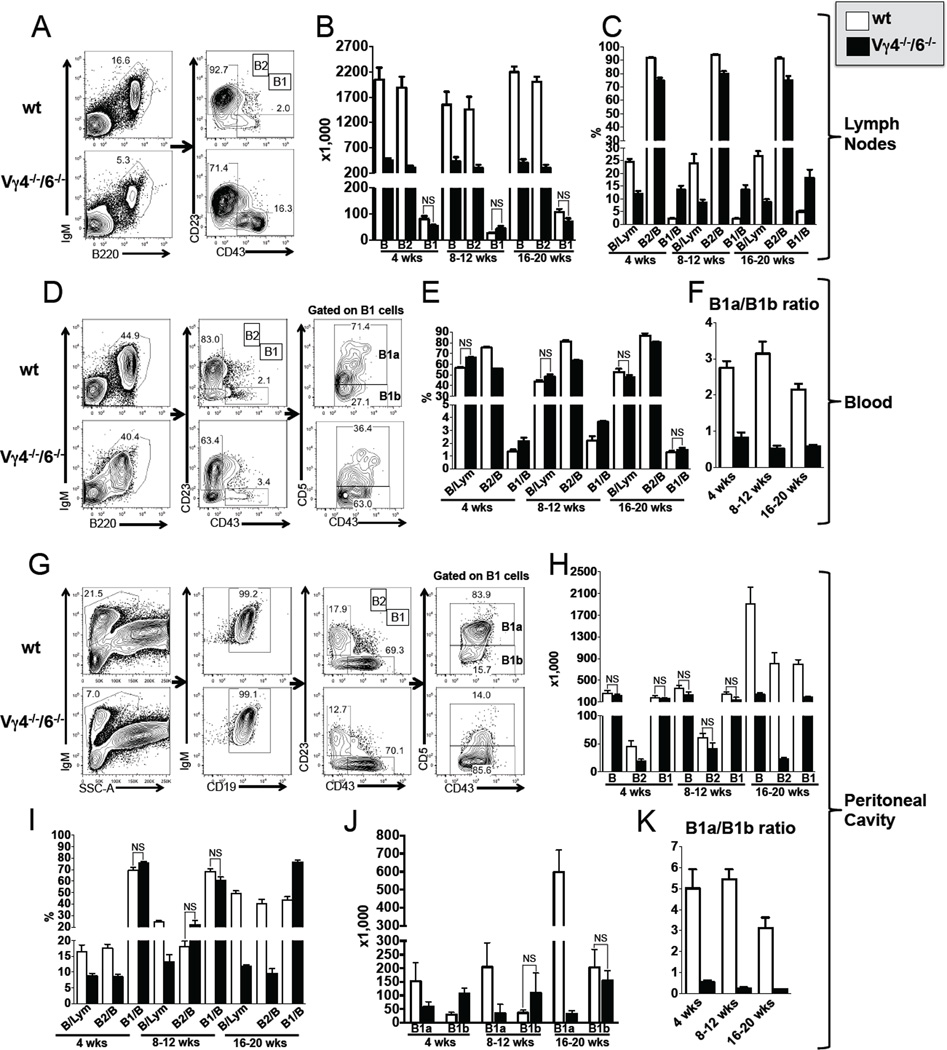
Figure 1. Influence of γδ T cells on peripheral mature B cell populations.
(A–K) Comparison of B cell populations in female C57BL/6 (B6) and B6.TCR-Vγ4−/−/Vγ6−/− (Vγ4−/−/6−/−) mice. Total B cells, B1 and B2 B cells, and B1a and B1b B cells were identified using the indicated markers. Panels A, D and G show representative staining profiles of individual 8 wks old mice. (A–C) Lymph node B cells: Panels B and C show total numbers and relative frequencies of inguinal lymph node B cells (both sides pooled), respectively, comparing mice of different ages. The frequency of total B cells was calculated relative to total lymphocytes, and the frequencies of B1 and B2 B cells relative to total B cells. (D–F) Blood B cells: Panels E and F show relative frequencies (total B, B1 and B2) and B1a/B1b ratios, respectively, comparing mice of different ages. (G–K) Peritoneal cavity B cells: Panels H and I show total numbers and relative frequencies, respectively, comparing mice of different ages. Panels J and K show total numbers of B1a and B1b cells and their ratio, respectively, comparing mice of different ages. n ≥ 4 mice per group. For clarity, only comparisons where no significant differences were found are marked (NS), all others are significant at a P value of <0.05 or less.

