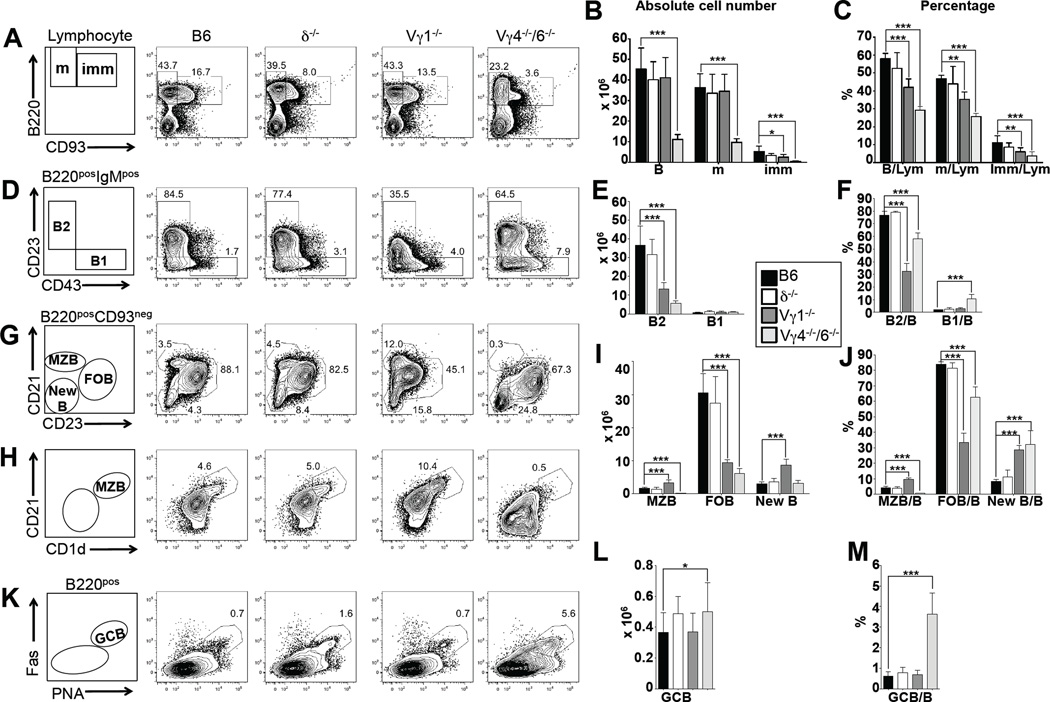
Figure 3. Influence of γδ T cells on splenic B cell populations.
(A–M) Comparison of B cell populations in 8 wks old female C57BL/6 (B6) (black columns), B6.TCR-δ−/− (δ−/−) (open columns), B6.TCR-Vγ1−/− (Vγ1−/−) (dark grey columns) and B6.TCR-Vγ4−/−/Vγ6−/− (Vγ4−/−/6−/−) (light grey columns) mice. Mature and immature B cells, B1 and B2 B cells, marginal zone B cells (MZB), follicular B cells (FOB), “new” B cells (New B) and germinal center B cells (GCB) were identified using the indicated markers. Panels A, D, G, H, and K show representative staining profiles of individual mice. (A–C) Relative frequencies (compared to total B cells) and absolute numbers of mature (m) and immature (imm) B cells. Panels B and C also show numbers and frequencies (compared to total splenic lymphocytes) of total B cells. (D–F) Relative frequencies (compared to total B cells) and absolute numbers of B1 and B2 cells. (G–J) Relative frequencies (compared to total B cells) and absolute numbers of marginal zone B cells (MZB), follicular B cells (FOB) and “new” B cells (New B) B1. Panels G and H show two different ways of identifying MZB, based on expression of CD21 in combination with CD23 or CD1d. The counts of MZB in panels I and J are based on the method shown in panel H. (K–M) Relative frequencies (compared to total B cells) and absolute numbers of germinal center B cells (GCB). n = 5–8 mice per group. For visibility, only significant differences between wt and the γδ-deficient mice are marked. *P<0.05, **P<0.01, ***P<0.001

