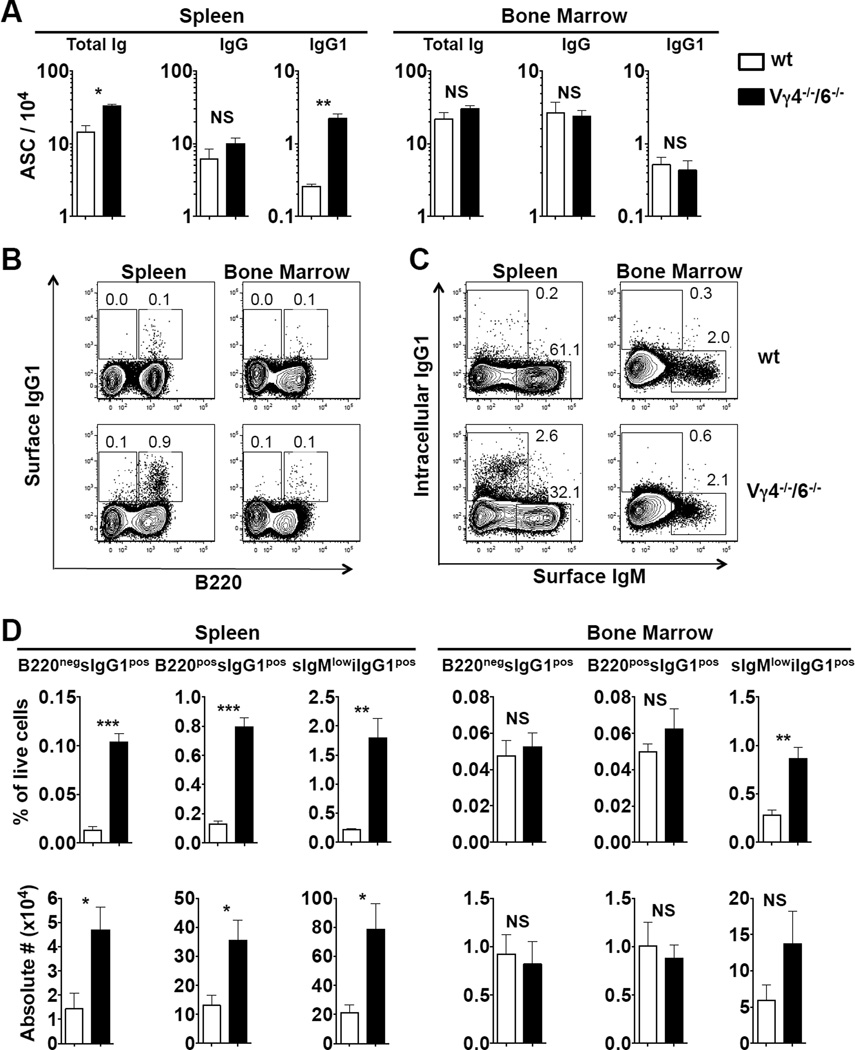
Figure 5. Antibody-producing cells (ASCs) are increased in the spleen of Vγ4−/−/6−/− mice.
(A) Total Ig-, IgG-, and IgG1-producing cells determined by ELISPOT assay were enumerated in spleen and bone marrow of female C57BL/6 (wt) and B6.TCR-Vγ4−/−/Vγ6−/− (Vγ4−/−/6−/−) mice. n = 4 per group. (B–C) Representative FACS plots showing surface IgG1-expressing cells (sIgG1pos cells, panel B) and intracellular IgG1-expressing cells (iIgG1pos cells, panel C) in spleen and bone marrow of above mice. Panel D shows relative frequencies and total numbers in spleen and bone marrow of mice indicated in (A–C). n = 4 mice per group. NS, not significant, *P<0.5, **P<0.01, ***P<0.001

