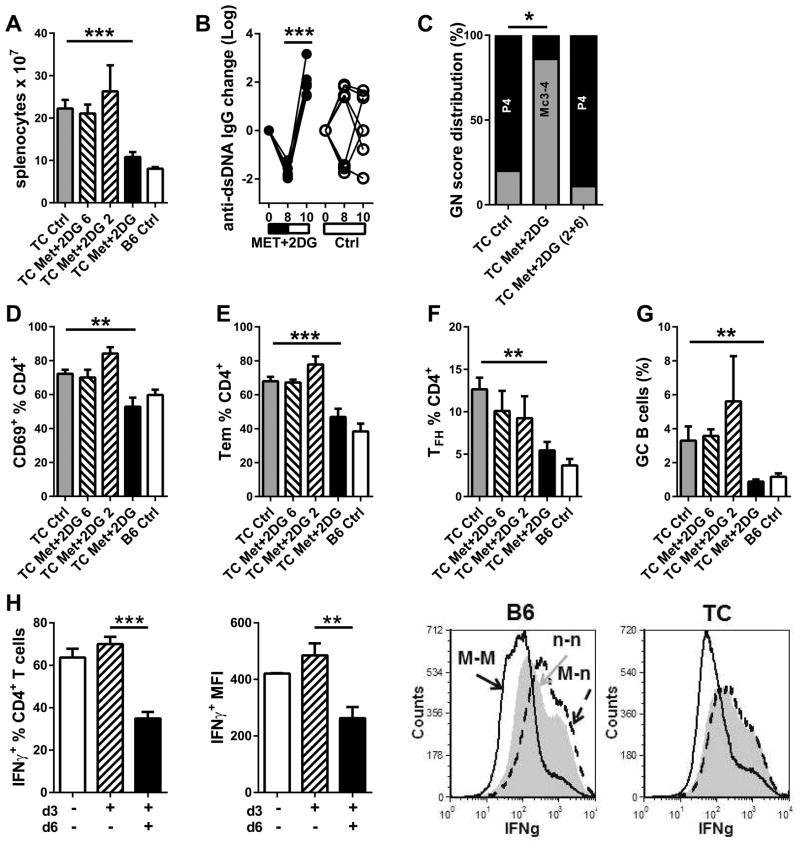
Figure 2. Cessation of Met+2DG treatment resulted in flares.
8-month old TC mice were treated with Met+2DG for 8 weeks, then mice were maintained on treatment (Met+2DG), or switched to plain water for an additional 2 or 6 weeks (Met+2DG 2 and Met+2DG 6). Untreated TC and B6 mice (Ctrl) were analyzed at the same time. A. Splenocyte numbers. B. Changes in individual serum anti-dsDNA IgG levels in mice in which treatment ceased for 2 weeks as compared to untreated mice. C. GN score distribution: P4: proliferative GN score 4; Mc3-4: Mesangial cellular score 3 and 4 (grouped Met+2DG 2 and Met+2DG 6). Percentages of CD69+ (D), CD44+ CD62L− TEM (E), and TFH (F) CD4+ T cells. G. Percentages B220+ B cells with a GC phenotype. N = 4–8 per group. H. B6 and TC CD4+ T cells were polarized in vitro with Met for 3 d, then washed and split into two fractions cultured in the same Th1 conditions with (black) or without (hatched) Met for an additional 3 d. Their percentage of IFNγ+ CD4+ T cells, as well as level of Mean fluorescence intensity (MFI) of the IFNγ+ production was compared to that of cells polarized for 6 d without Met (white). Representative FACS overlays are shown on the right for each strain. N = 3 per strain. ** p < 0.01, *** p < 0.001.

