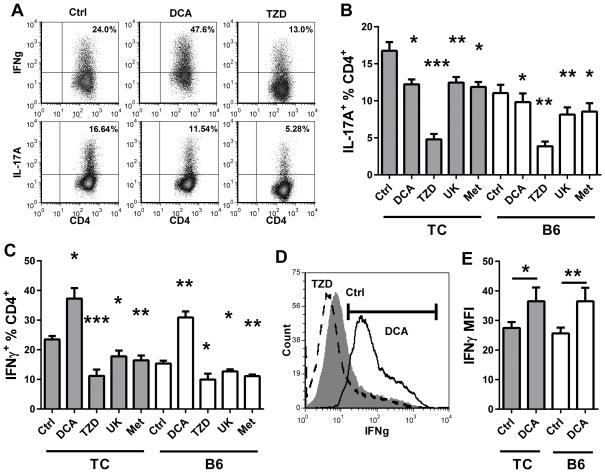
Figure 8. DCA enhanced Th1 polarization.
CD4+ T cells from 2 month old TC and B6 mice were polarized in Th1 or Th17 conditions in the presence of DCA, TZD, UK5099 (UK) or Met for 3 d, after which intracellular IL-17A or IFNγ was compared to untreated controls (Ctrl). A. Representative IFNγ and IL-17A production in TC CD4+ T cells, Ctrl and treated with DCA or TZD. B. Percentage of IL-17A+ CD4+ T cells. C. Percentage of IFNγ+ CD4+ T cells. D. Representative IFNγ staining in TC CD4+ T cells treated with DCA (solid line), TZD (broken line, and Ctrl (filled histogram). The IFNγ+ gate is shown. E. MFI of the IFNγ+ population as shown in (D) for DCA-treated and Ctrl CD4+ T cells. For B and C, comparisons were made to the Ctrl samples in each strain. In E, statistical significance is shown for paired t tests between each treated and Ctrl sample. N = 6 per strain. * p < 0.05, ** p < 0.01, *** p < 0.001.

