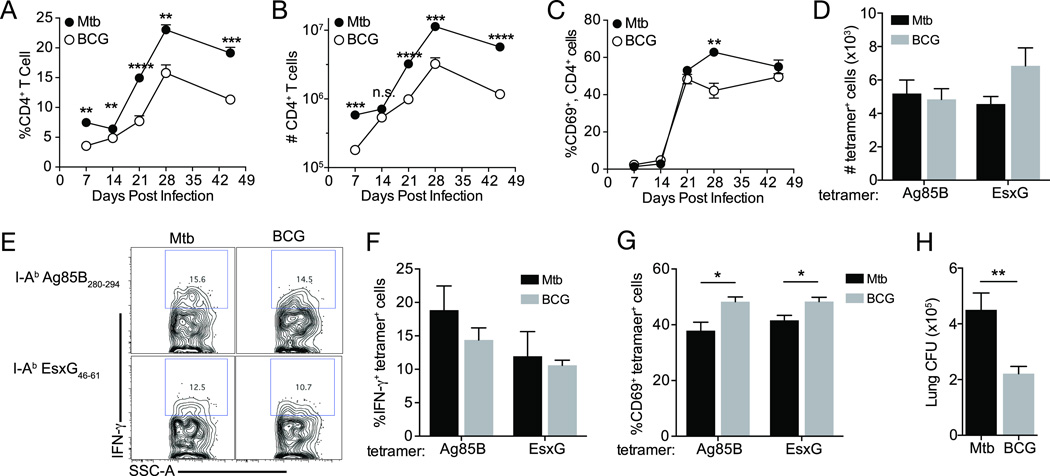
Figure 4.
Fewer BCG than M. tuberculosis are required for equivalent CD4 T cell activation in the lungs. CD4+ T cells were quantitated in lungs of WT mice following aerosol infection. (A) Frequency of CD4+ T cells expressed as the percentage of total lung cells. (B) Total number of lung CD4+ T cells, calculated from cell frequencies indicated in (A). Frequency of CD4+ cells expressing CD69 (C). (D) Total numbers of I-Ab:Ag85B280–294 and I-Ab:EsxG46–61-specific CD4 T cells. (E) Representative flow plots of IFN-γ expression in antigen-specific CD4 T cells. Frequencies of IFN-γ+ (F) and CD69+ (G) antigen-specific cells. (H) Lung CFU 21 days following BCG or M. tuberculosis infection. Data are expressed as mean ± SEM and are representative of 2 experiments where n = 4 mice per time point for each bacterial infection. Student t test was used to compare cell frequencies and cell numbers in M. bovis BCG- versus M. tuberculosis-infected mouse lungs; *, P<0.05; **, P<0.01; ***, P<0.005; ****, P<0.0001

