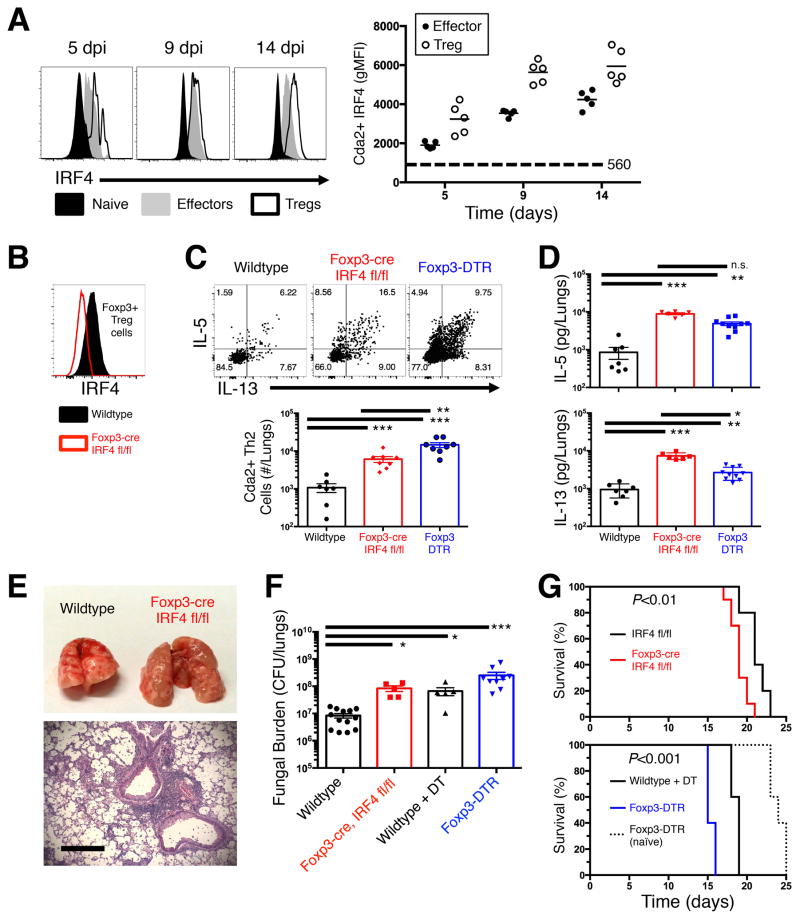
Figure 4. IRF4 is required by Treg cells to efficiently suppress the detrimental Th2 cell response to pulmonary cryptococcal infection.
(A) Flow cytometry histogram (left) and composite graphs (right) of Interferon Regulatory Factor 4 (IRF4) expression in CD44 low naïve, Cryptococcus-specific (Cda2+) Foxp3+ Treg, Cda2+ Foxp3− effector cells collected from the lungs of mice. (B) Histogram of IRF4 expression by lung Treg cells in wildtype and Foxp3-cre IRF4 fl/fl mice 14 days post infection. (C) Cda2+ Th2 cells producing interleukin-5 (IL-5) and/or IL-13 in the lungs of wildtype, Foxp3-cre, and Foxp3-DTR mice 14 days post-infection. (D) IL-5 and IL-13 secreted in lung homogenates from wildtype, Foxp3-cre, and Foxp3-DTR mice 14 days post-infection. (E) Photograph of gross-level pathology of lungs from mice infected 14 days previously (top). Hematoxylin and eosin staining of lung sections from Foxp3-cre mice 14 days post-infection (bottom). Bar = 200 μm. (F) Colony forming units (CFU) in the lungs of wildtype +/− diphtheria toxin (DT), Foxp3-cre IRF4 fl/fl, or Foxp3-DTR + DT. (G) Survival curve of IRF4 fl/fl and Foxp3-cre IRF4 fl/fl infected mice (top). Survival curves of naïve Foxp3-DTR, as well as infected wildtype and Foxp3-DTR mice – all groups treated every other day with 200 ng DT beginning at 5 days post-infection (bottom). Survival curves include 10 mice per group, and P-values calculated by log rank test. Pairwise comparisons were made by Man-Whitney U with Bonferoni adjustments for multiple comparisons. *** = P<0.0005, ** = P<0.005, * = P<0.05, n.s. = non-significant. All data are presented as the mean ± standard error of the mean and represent two independent experiments.

