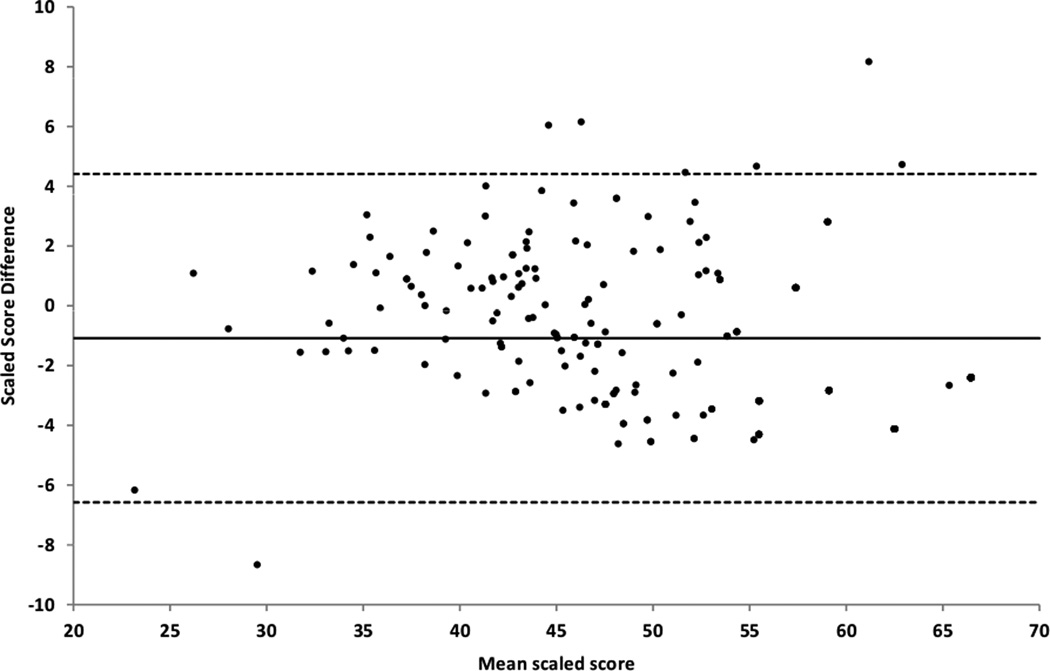
Figure 3.
Bland-Altman plot for scores based on the short form and the full item bank
The x-axis represents the average of the short form score and full item bank score. The y-axis represents the difference between short form score and full item bank score. The solid line is the mean difference between the short form based scores and full item bank based scores.
The two dash lines indicate the 95% limits of agreement.

