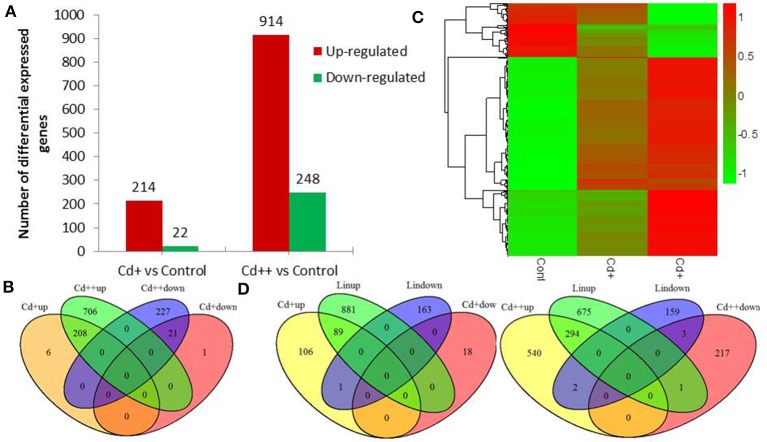
Figure 2.
Differentially expressed genes of Oryza sativa in response to Cd stress from RNA-seq data. (A) Summary of significant up- and down-regulated genes between two Cd concentration gradient treated roots. (B) Venn diagram analysis showed a total of 1169 differentially expressed genes in different conditions. (C) Heatmap showed expression increased or decreased trend of total differential expressed genes with the rise of Cd concentration after scaling each gene to a mean of 0 and standard deviation of 1. (D) Overlap of differential expressed RAPDB genes from RNA-Seq and Lin et al microarray study. Total number of RAPDB genes was 45,990. The P-value of overlap significant statistical test was 2.2E-16 and 2.2E-16 by Fisher exact test, respectively.

