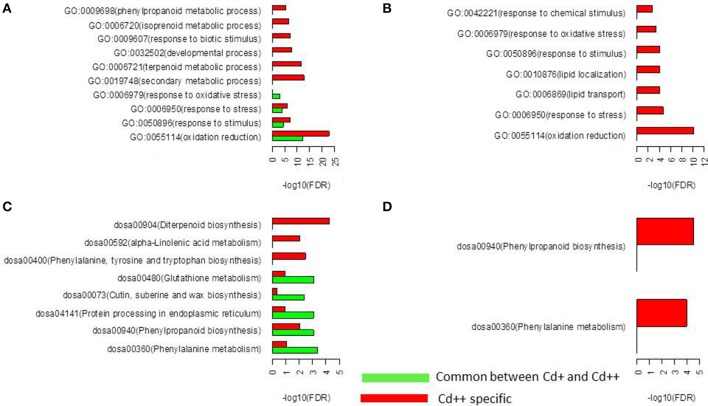
Figure 4.
Function enrichment analysis of differentially expressed genes. (A) Gene Ontology (GO) enrichment analysis for the up-regulated genes. Only the top false discovery rate (FDR) ranked 10 enrichment of GO terms from “biological process” category were listed. (B) GO enrichment analysis for the down-regulated genes. Only “biological process” category were listed. (C) KEGG pathway analysis for the up-regulated genes. (D) KEGG pathway analysis for the down-regulated genes.

