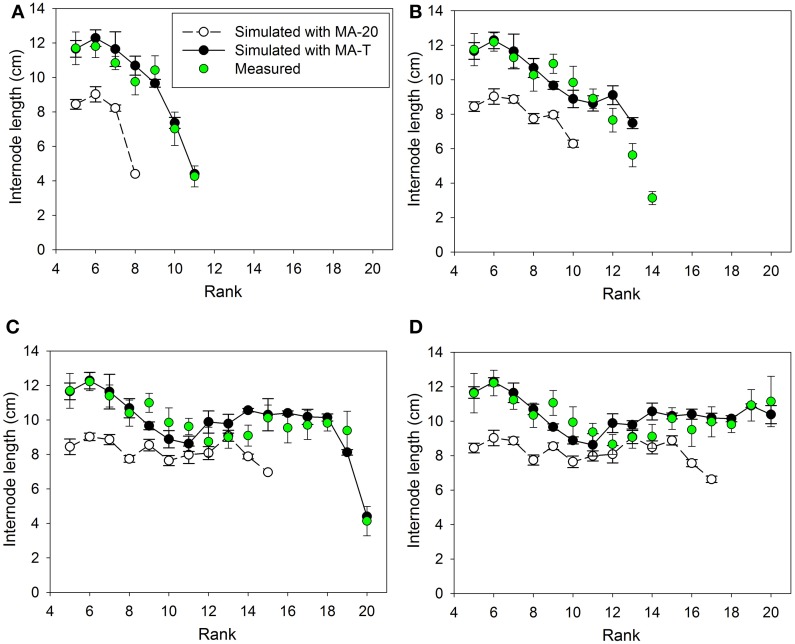
Figure 4.
Measured and simulated patterns of internode lengths along the main stem of greenhouse grown cucumber plants for rank 5 to the top of the plant for measured and simulated organ sizes. The measured data were obtained in Experiment 2 (E2) and the simulated patterns resulted from the temperature-insensitive model (MA-20) and the temperature-sensitive model (MA-T). Measured (n = 12) and simulated (n = 5) data were from day of year (A) 179, (B) 182, (C) 189, and (D) 192. Vertical bars represent standard deviations. Straight lines, which connect symbols, are shown to visualize the pattern of simulated internode lengths along the main stem.

