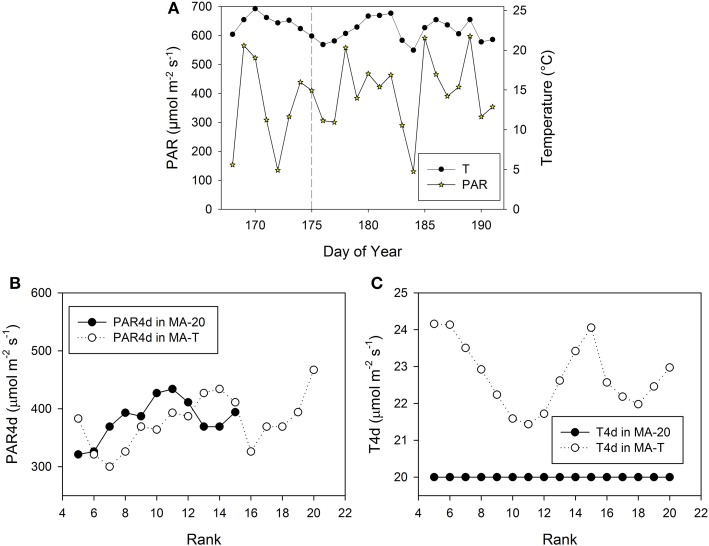
Figure 5.
Measured climatic data of photosynthetic active radiation, PAR (μmol m−2 s−1) and mean daily temperature (°C, 24 h) inside the greenhouse in Experiment E2 (A). The vertical dashed line indicates the day, when the internodes at rank 5 had a length of ca. 3 cm. PAR4d (μmol m−2 s−1) is the mean PAR of four days starting six days before the internode has reached its maximum growth rate (B). T4d (°C) is the corresponding temperature data (C).

