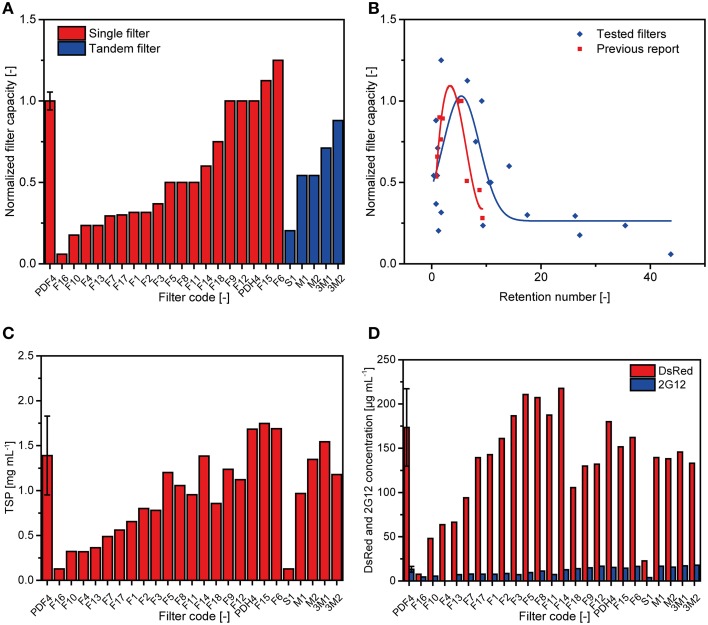
Figure 2.
Performance of conventional depth filters in terms of capacity and protein binding. (A) The capacity of 24 conventional depth filter setups (single filter or tandem filter) was tested in five batches and normalized to two runs of the reference filter P1 (PDF4) included in each batch (Buyel and Fischer, 2014c). (B) Normalized capacity over RN plot showing the results for the 25 filters (including the reference) tested here (blue) compared to a previous report (red) (Buyel and Fischer, 2014c). The maximum of a Gaussian function fitted to the data (blue line) indicates the theoretical optimum for RN and capacity. A cubic fit to the previously reported data is shown for comparison (red line). (C) TSP concentrations in the filtrates of the different filter setups as determined by the Bradford method. (D) Concentrations of DsRed and 2G12 were determined in the different filtrates by fluorescence spectroscopy and SPR spectroscopy, respectively. Error bars indicate the standard deviation of all reference runs (n = 10).

