Figure 4.
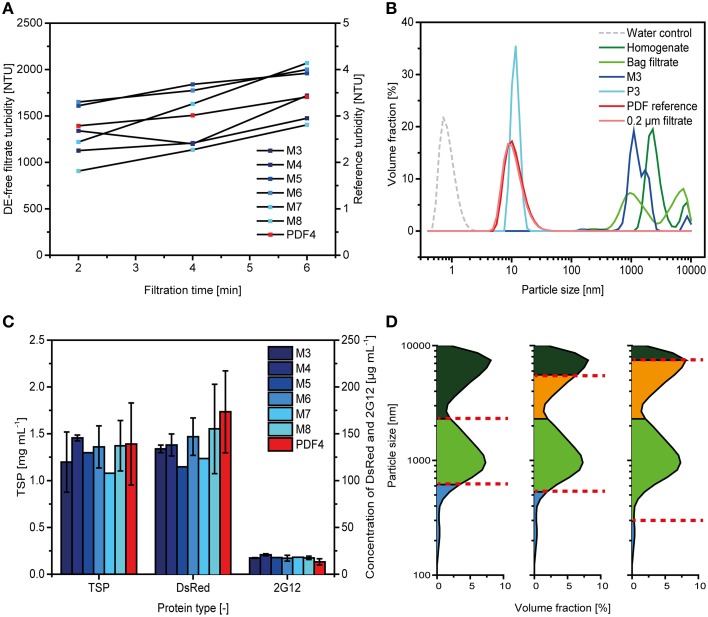
Comparison of filters lacking diatomaceous earth with conventional depth filters. (A) Depth filtrate turbidities observed during clarification for DE-free filters and a DE-containing reference. (B) Particle size distributions determined for selected depth filtrates compared to those observed for preceding (homogenate, bag filtrate) and subsequent (0.2 μm filtration) process steps. All measurements were taken with a Zetasizer NanoZS. (C) TSP, DsRed and 2G12 concentrations in different depth filtrates as determined by the Bradford method, fluorescence spectroscopy and SPR spectroscopy, respectively. Error bars indicate standard deviations (n ≥ 3). (D) Particle retention by depth filters selected based on actual particle size distributions (F6, left), prediction by RN (PDF4, middle) and empirical data (F14, right). Particles retained by the first and second filter layers are colored dark green and green, respectively. Particles in the filtrate are colored blue and those not retained on the first filter layer due to suboptimal selection of the retention rate are colored orange.

