Fig. 4.
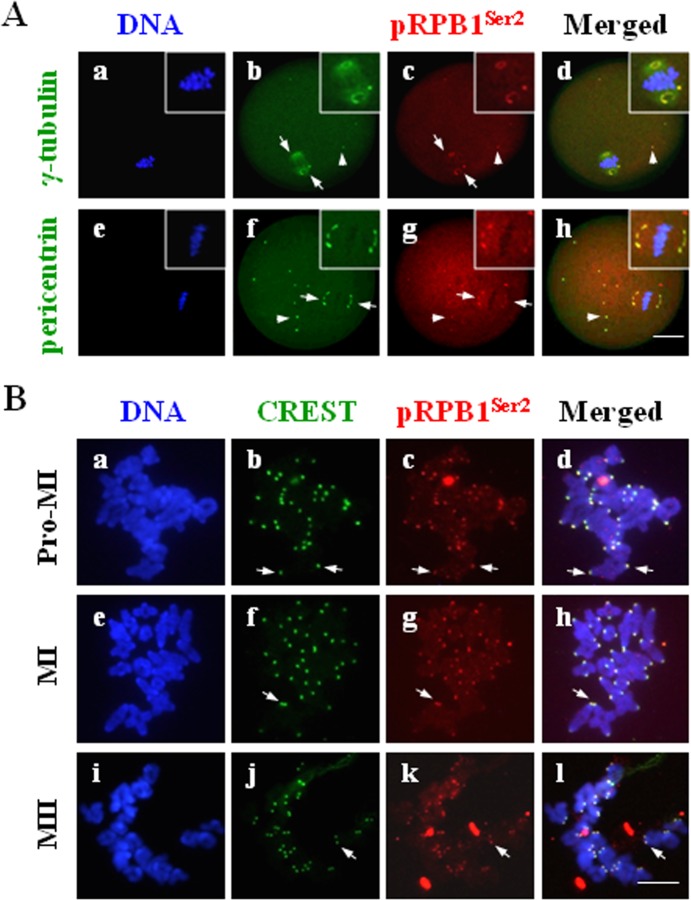
A: Colocalization of pRPB1Ser2 with MTOC proteins in mouse oocytes. Immunofluorescence analysis revealed colocalization of pRPB1Ser2 with the MTOC core components, γ-tubulin or pericentrin. DNA was visualized in blue, pRPB1Ser2 was visualized in red, and γ-tubulin or pericentrin was visualized in green. Scale bar = 20 μm. pRPB1Ser2 was specially co-localized with γ-tubulin or pericentrin in the spindle polar area, as well as in some cytoplasmic MTOCs (b–d, f–h: arrows). B: pRPB1Ser2 concentration on chromosome centromeres in mouse oocytes. pRPB1Ser2 was visualized in red, CREST was visualized in green, and DNA was visualized in blue. Scale bar = 10 μm. pRPB1Ser2 was persistently aggregated on the chromosome centromere area in oocytes from the pro-MI to MII stage (b–c, f–h, k–m: arrows).

