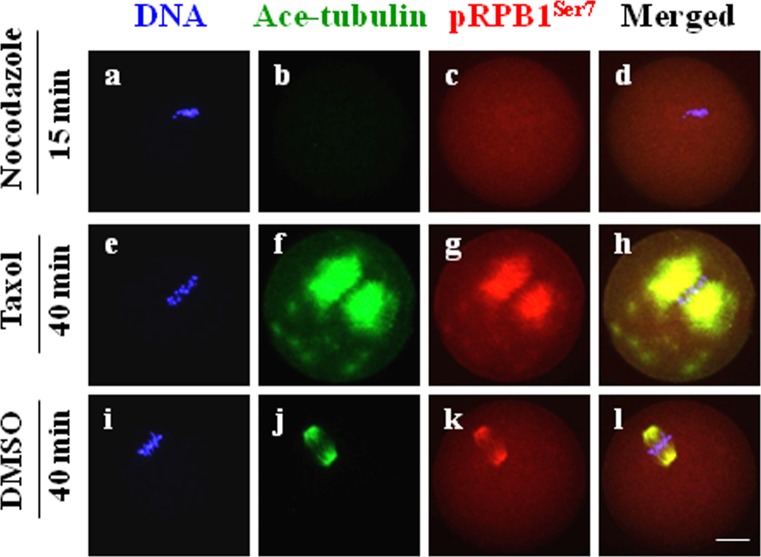
Fig. 8.
Pharmacological verification of the morphological relationship between pRPB1Ser7 and microtubules in MI oocytes. Changes in pRPB1Ser7 distribution were essentially the same as those of microtubules in MI oocytes treated with nocodazole (10 μM) and taxol (10 μM). DNA was visualized in blue, pRPB1Ser7 was visualized in red and Ace-tubulin was visualized in green. Scale bar = 20 μm.

