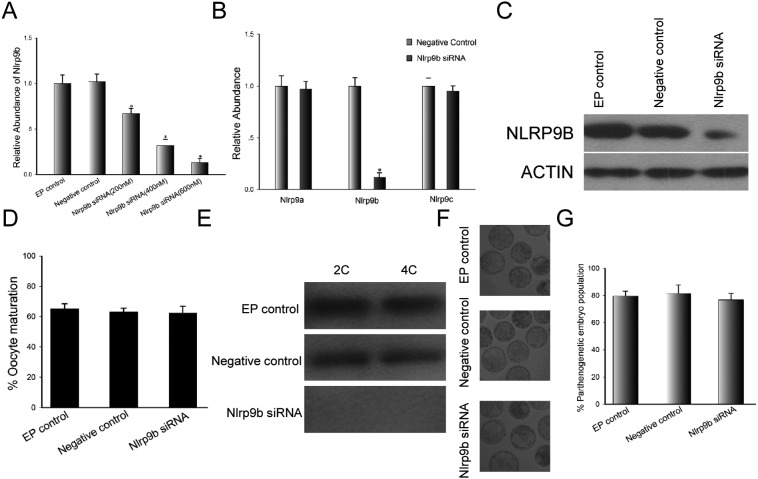
Fig. 4.
GV-stage oocyte maturation after electroporation with Nlrp9b siRNA. (A) Relative abundance of Nlrp9b transcripts following electroporation of GV oocytes with custom siRNA at different concentrations (200 nM, 400 nM and 600 nM) and culture for 48 h. The data were normalized to the electroporation control (EP control). Statistical comparisons were made using ANOVA and LSD tests (* P < 0.05). (B) Nlrp9a, Nlrp9b and Nlrp9c gene expression by qRT-PCR in mouse oocytes at 24 h after electroporation with Nlrp9b siRNA (600 nM). Results were normalized to the negative control (600 nM). * P < 0.05. (C) Western blot analysis of mouse oocytes derived from the EP control, negative control (600 nM) and Nlrp9b siRNA group (600 nM) after 24 h culture. ACTIN was used as an internal control. (D) Oocyte maturation rate following electroporation of GV-stage oocytes in the EP control, negative control (600 nM) and Nlrp9b siRNA group (600 nM). (E) Western blot analysis of mouse parthenogenetic embryos derived from the EP control, negative control (600 nM) and Nlrp9b siRNA group (600 nM). 2C, 2-cell stage; 4C, 4-cell stage. (F) Morphological appearance of parthenogenetic embryos obtained from the control and Nlrp9b siRNA groups after culture for 3.5 days. The original magnification was × 100. (G) Percentage of parthenogenetic embryos derived from the control and Nlrp9b siRNA groups after culture for 3.5 days.

