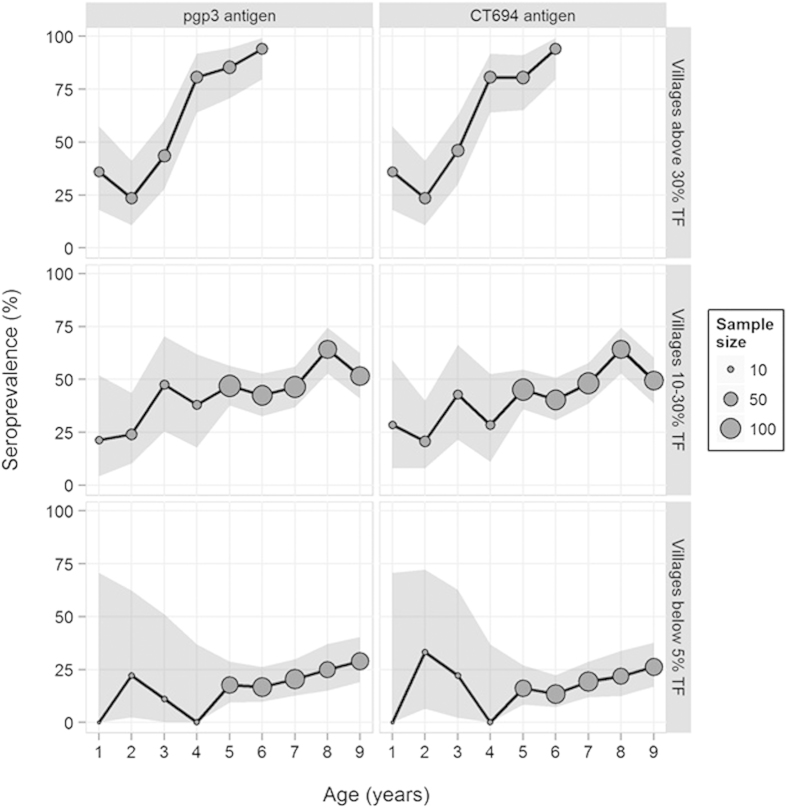
Figure 1. Seroprevalence percentages by age broken down by antigen (pgp3 and CT694) and village prevalence (below 5% TF, 10-30% TF, and above 30% TF).
Seroprevalences are represented with circles scaled by the sample size and shaded regions denote 95% confidence intervals. For antigen-specific seroprevalences by age, confidence intervals use the incomplete beta function19 to account for village-level clustering (except when the seroprevalence was zero and Clopper-Pearson (1934) limit19 were used).

