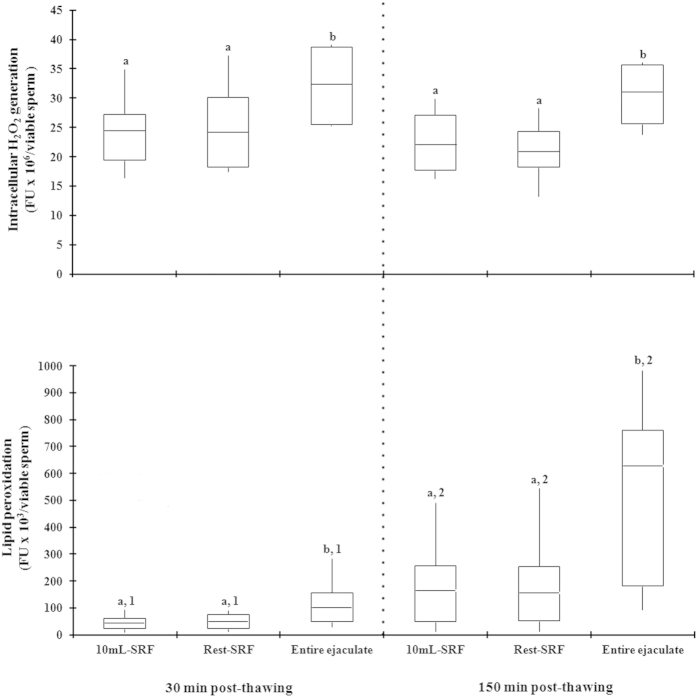
Figure 5. Box-whisker plot showing variations in sperm functionality parameters assessed at 30 (left) and 150 (right) min post-thawing in cryopreserved sperm samples of first 10 mL of sperm rich ejaculate fraction (P1), the rest of sperm rich ejaculate fraction (P2) or a reconstituted entire ejaculate (EE, mixing aliquots of the portions collected separately) of 14 ejaculates (2 per boar).
Boxes enclose the 25th and 75th percentiles; the line is the median; and the whiskers extend to the 5th and 95th percentiles. a,b indicate significant differences (P < 0.05) among the ejaculate portions within the same post-thaw incubation time and 1,2 indicate significant differences (P < 0.05) between post-thaw incubation times within the same ejaculate portion. FU: arbitrary fluorescence units.

