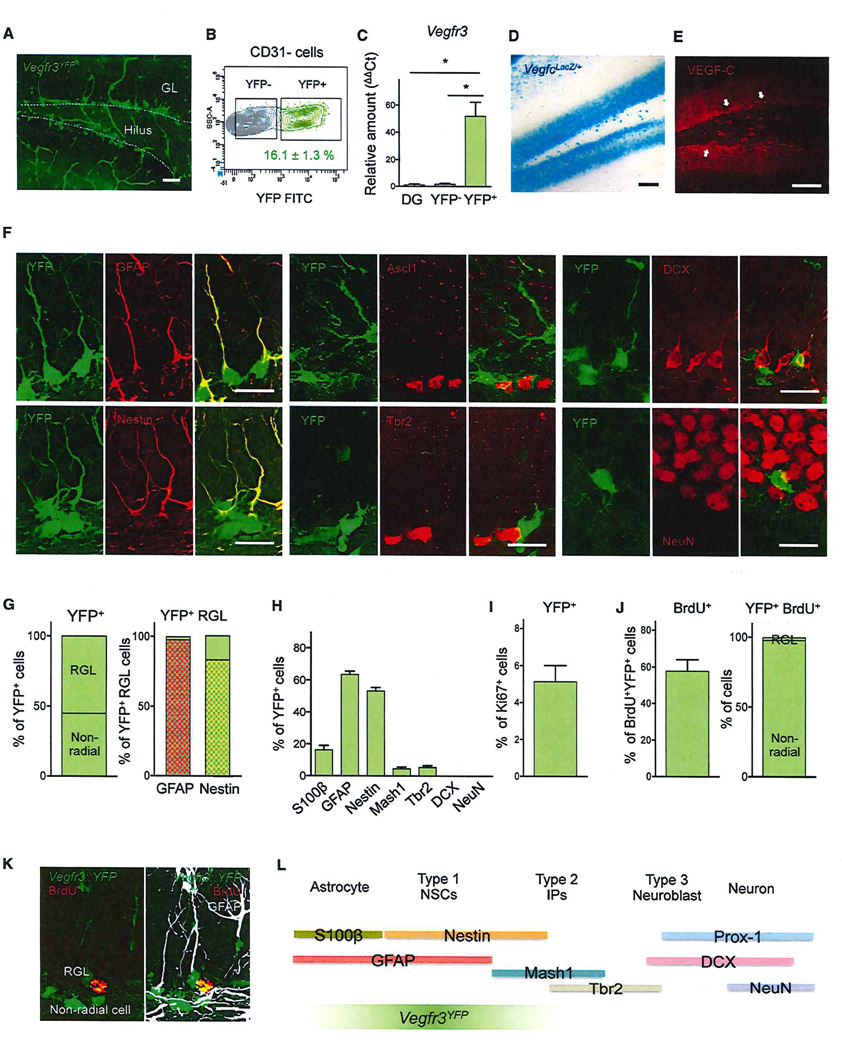
Figure 1. Vegf-c/Vegfr3 Are Expressed by Adult Hippocampal Stem Cells.
(A) Coronal DG section of an adult Vegfr3::YFP mouse. YFP expression is detected both in vessels and SGZ cells. White dotted line indicates SGZ.
(B) isolation of Vegfr3YFP cells from the DG of adult Vegfr3::YFP mice. After exclusion of CD31+ endothelial cells, a subset of Vegfr3YFP cells were sorted by FACS.
(C) qRT-PCR analysis of FACS-sorted cells from the DG of Vegfr3::YFP adult mice. Vegfr3 transcripts are specifically enriched in Vegfr3YFP cells compared to total DG neural cells (non-endothelial DG cells) and Vegfr3YFP-negative cells, n = 3 independent experiments; bars: mean ± SEM; Student’s t test: p < 0.05 (*).
(D and E) Coronal DG section of adult VegfclacZ/+ mouse stained with X-gal and of wild-type mouse labeled with anti-VEGF-C Ab (E). White arrows indicate a higher level of VEGF-C expression in SGZ.
(F) Representative images of coronal DG sections in adult Vegfr3::YFP mice stained with Abs against markers of RGL (GFAP and Nestin), progenitor cells (Ascl1 and Tbr2), neuroblasts (DCX), and neurons (NeuN) (red).
(G) Quantification of Vegfr3YFP SGZ cells by their morphology. Percentage of Vegfr3YFP RGL cells expressing GFAP and Nestin.
(H) Quantification of Vegfr3YFP SGZ cell subtypes according to their antigen expression. y axis: % of YFP+ marker+ cells/YFP+ cells. Total 30–500 cells were counted from three to six sections.
(I) 5% of Vegfr3YFP SGZ cells has entered the cell cycle (Ki67+). n = 100–150 cells/section, counted from seven sections. Bars: mean ± SEM.
(J) Vegfr3YFP cells represent 60% of BrdU+ SGZ cells. Most BrdU+Vegfr3YFP cells are non-radial cells (98%), and only a few of them are RGL cells (2%). n = 30–50 cells counted from five sections.
(K) Vegfr3YFP SGZ cell morphology and activity. An anti-GFAP Ab labels RGLs (white), but not YFP+-non-radial cells. A 3-hr pulse of BrdU (red) labels exclusively non-radial YFP+ cells.
(L) Comparison of the expression of Vegfr3YFP and other stage-specific markers in SGZ cells. Vegfr3YFP expression is specific to NSCs and progenitor cells.
The scale bars represent 100 µm (A, D, and E) and 16 µm (F and K).
See also Figure S1.

