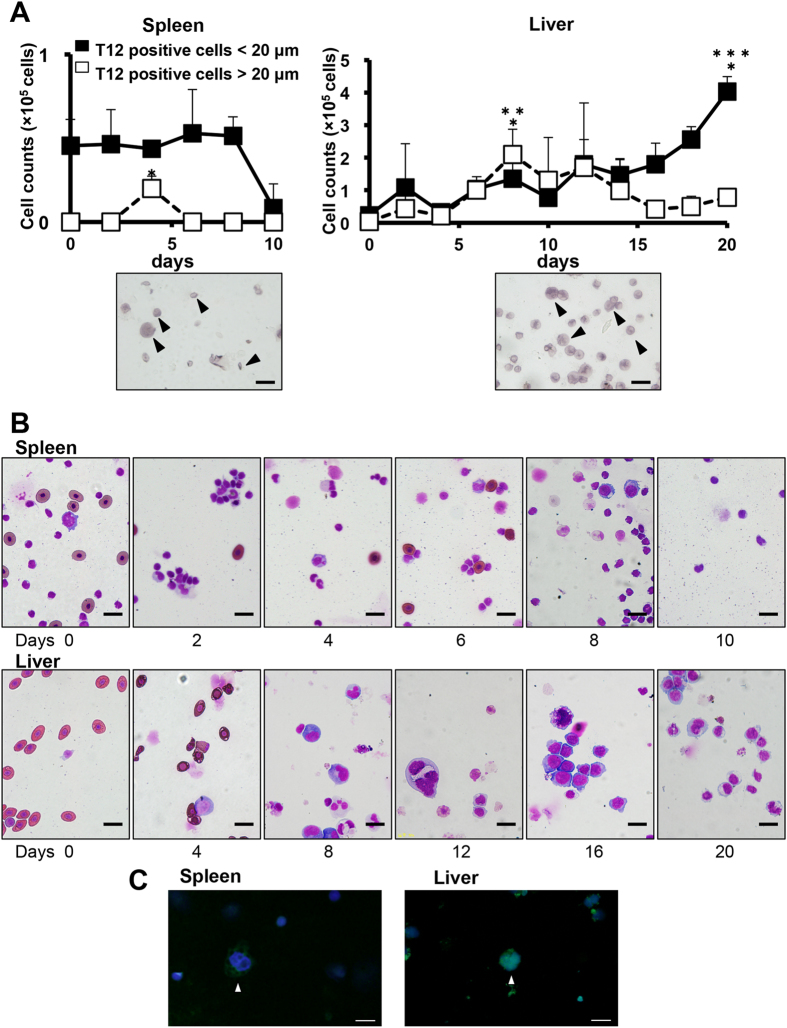
Figure 3. Proliferation and differentiation of hepatic and splenic thrombocytic cells.
(A) Thrombocytic cell counts during liquid culture of spleen (Left) and liver (Right) cells in the presence of xlTPO. Cultured hepatic cells were cytocentrifuged onto slides, immunostained for T12, and counted. Open squares show T12-positive cells >20 μm; black squares indicate cells <20 μm. *P < 0.05 vs. day 0; **P < 0.05 vs. day 0; ***P < 0.05 vs. day 20 in T12-positive large cells. The lower panel shows large and small T12-positive cells derived from splenic and hepatic cells after 4 and 8 days of culture in medium containing xlTPO. Scale bars represent 20 μm. Graphs represent means + SD, n = 5. (B) After 2 to 20 days culture in the presence of xlTPO, hepatic or splenic cells were cytocentrifuged onto glass slides and stained with May-Grunwald-Giemsa (MGG). Scale bar indicates 20 μm. (C) The morphology of T12-positive splenic or hepatic cells after culture in the presence of xlTPO for 4 days. Immunostaining for T12 was performed. Biotinylated T12 was detected by streptavidin-conjugated Alexa Fluor 488 (green). Nuclei were counterstained with Hoechst 33342. Bars represent 20 μm.

