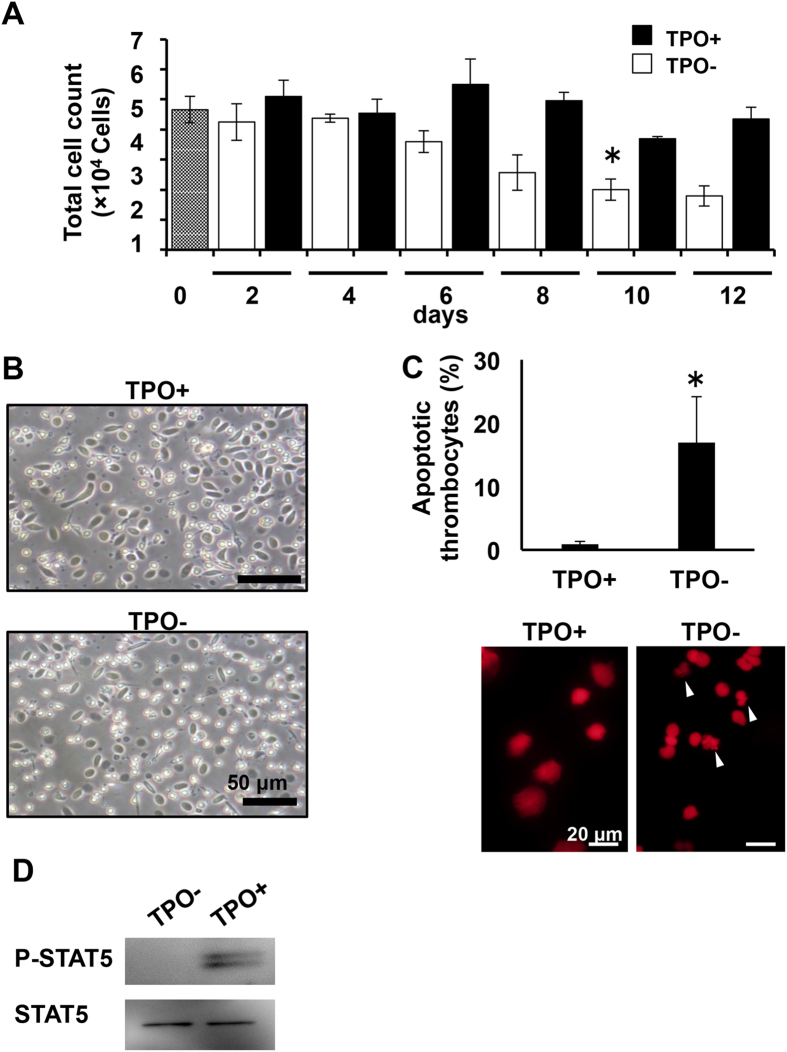
Figure 6. Functions of xlTPO–xlMpl signalling in peripheral thrombocytes.
(A) Peripheral thrombocytes were collected by density-gradient centrifugation and cultured in dα-MEM with xlTPO. Thrombocyte viability was assessed by trypan blue staining. Thrombocyte numbers are indicated after stimulation with 10 ng/mL xlTPO (black bars) and without stimulation (white bars). Graphs represent means ± SD, n = 3. *P < 0.05 vs. day 0. (B) Thrombocyte morphology in suspension in the presence (upper panel) or absence (lower panel) of xlTPO for 8 days of culture. (C) Representative image of apoptotic cells detected by Propidium iodide nuclear staining. Apoptotic cells were counted after 8 days of culture. Apoptotic nuclei are marked with arrows (Bar, 20 μm). Graphs represent means + SD, n = 3. *P < 0.05 vs. TPO+. (D) STAT5 phosphorylation in thrombocytes. Western blots of P-STAT5 and STAT5 in the presence or absence of xlTPO. Uncropped gel images are shown in Supplementary Fig. S9.

