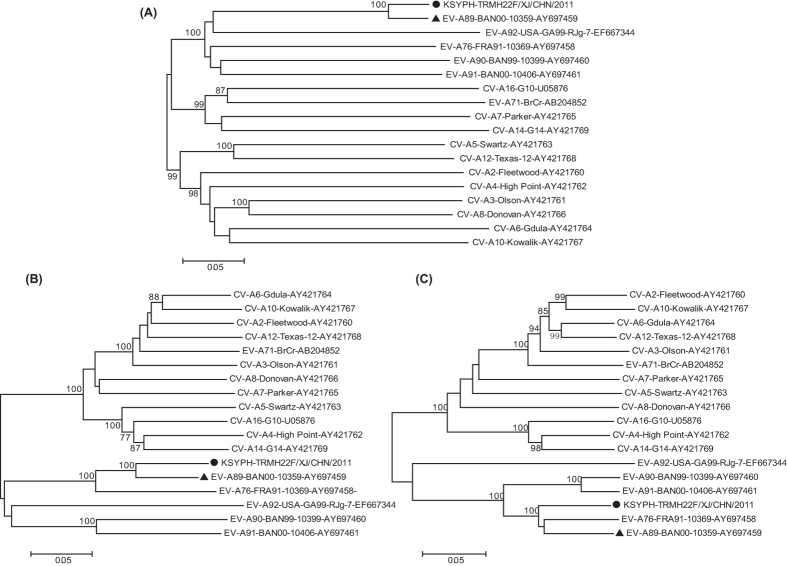
Figure 2. Phylogenetic relationships based on the P1, P2, and P3 genome regions of enterovirus A (EV-A).
The Chinese EV-A89 strain (solid circles) and 17 EV-A prototype strains were analysed by nucleotide sequence alignment using the neighbour-joining algorithms implemented in the MEGA 5.0 program. Numbers at the nodes indicate bootstrap support for that node (percentage of 1000 bootstrap replicates). The solid triangle indicates the EV-A89 prototype strain. The scale bars represent the genetic distance. All panels have the same scale. (A) P1 coding sequences, (B) P2 coding sequences, and (C) P3 coding sequences.

