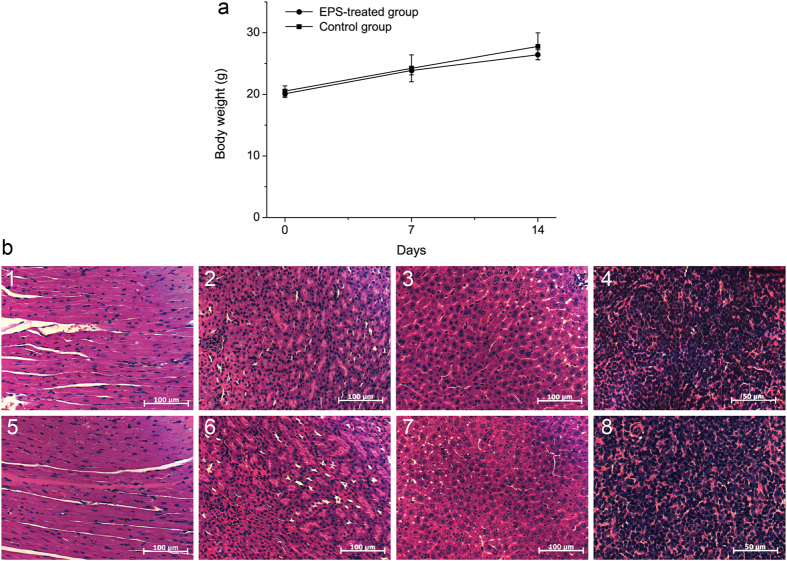
Figure 6. Effect of SM1127 EPS on the body weight (a) and organs (b) of KM mice in a 14-day feeding test.
In graph (a) data are shown as the mean weight of five mice in each group (mean ± SEM). In graph (b) 1 and 5 are heart sections (200×); 2 and 6 are kidney sections (200×); 3 and 7 are liver sections (200×); 4 and 8 are spleen sections (400×). 1, 2, 3 and 4 were H2O-treated and 5, 6, 7 and 8 were EPS-treated. The sections were stained with hematoxylin-eosin (HE) and observed by light microscopy (Axio Imager. A2, Zeiss, Germany). The photographs were taken by Axio Vision 4.8.2 software.

