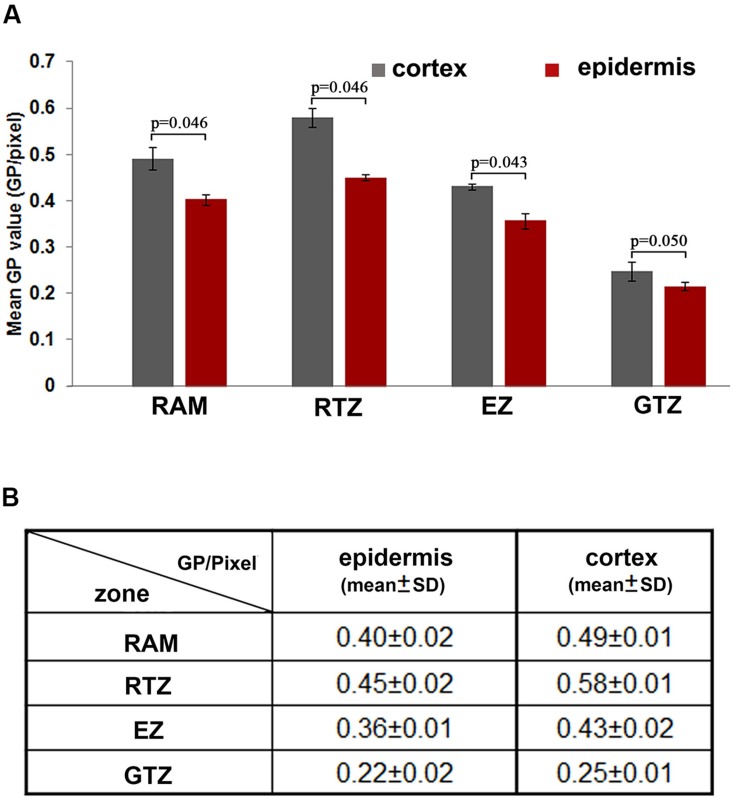
FIGURE 2.
Distribution of the lipid order along the different cell layers of the root apical region. (A) Different distribution of GP values in cortical and epidermal cells in root apical functional regions. Blue: GP/pixel measured from the root cortex; red: GP/pixel measured from the epidermis. Statistical significance between the cortical and epidermal layers, according to the Mann–Whitney u-test: (n = 12, significant difference: p < 0.05; no significant difference: p > 0.05; p-values were presented). (B) Mean GP values (GP per pixcel) and standard deviation measured from different regions, the mean values were calculated from 12 roots. RAM, root apical meristem (100 μm from QC); RTZ, root transition zone; 100–250 μm from QC, EZ, elongation zon, 250–550 μm from QC; GTZ, growth differentiation zone, 550–750 μm.

