FIGURE 4.
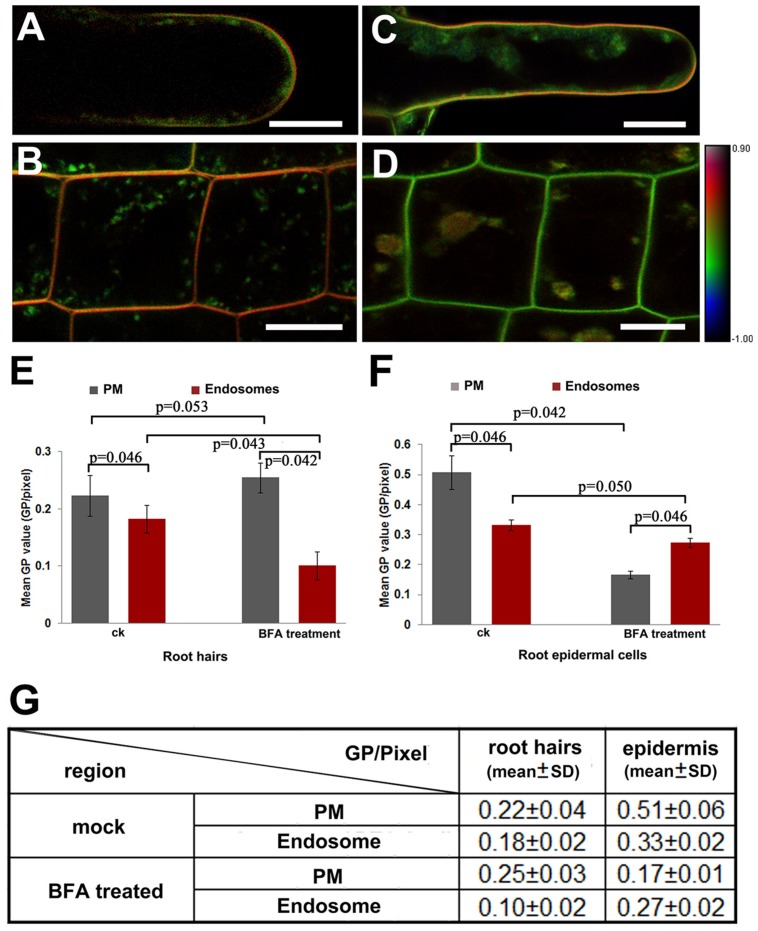
Asymmetrical distribution of lipid order in the PM and endosomes. (A,B) Quantitative visualization of lipid order in root hairs (A) and epidermal cells in the RTZ (B) treated in mock solution (1:1000 DMS for 30 min at room temperature). Scale bar = 25 μm. (C,D) Quantitative visualization of lipid order in a root hair (C) and epidermal cells (D) from an Arabidopsis seedling incubated in medium containing BFA (33 μM for 30 min at room temperature). Scale bar = 25 μm. (E,F) Distribution of GP values in the PM and endosomes in root hairs (E) and epidermal cells (F) in mock control (ck) and in BFA sulution. Error bars indicated the standard deviation. Six roots were selected for statistical analysis. Five different RTZ epidermal cells (n = 30) and three tip growing root hairs (n = 18) in each roots were analyzed. Statistical significance between sample was determined by the Mann–Whitney u-test (significant difference: p < 0.05; no significant difference: p > 0.05; p-values were presented). (G) Mean GP values and standard deviation between different regions and treatments.

