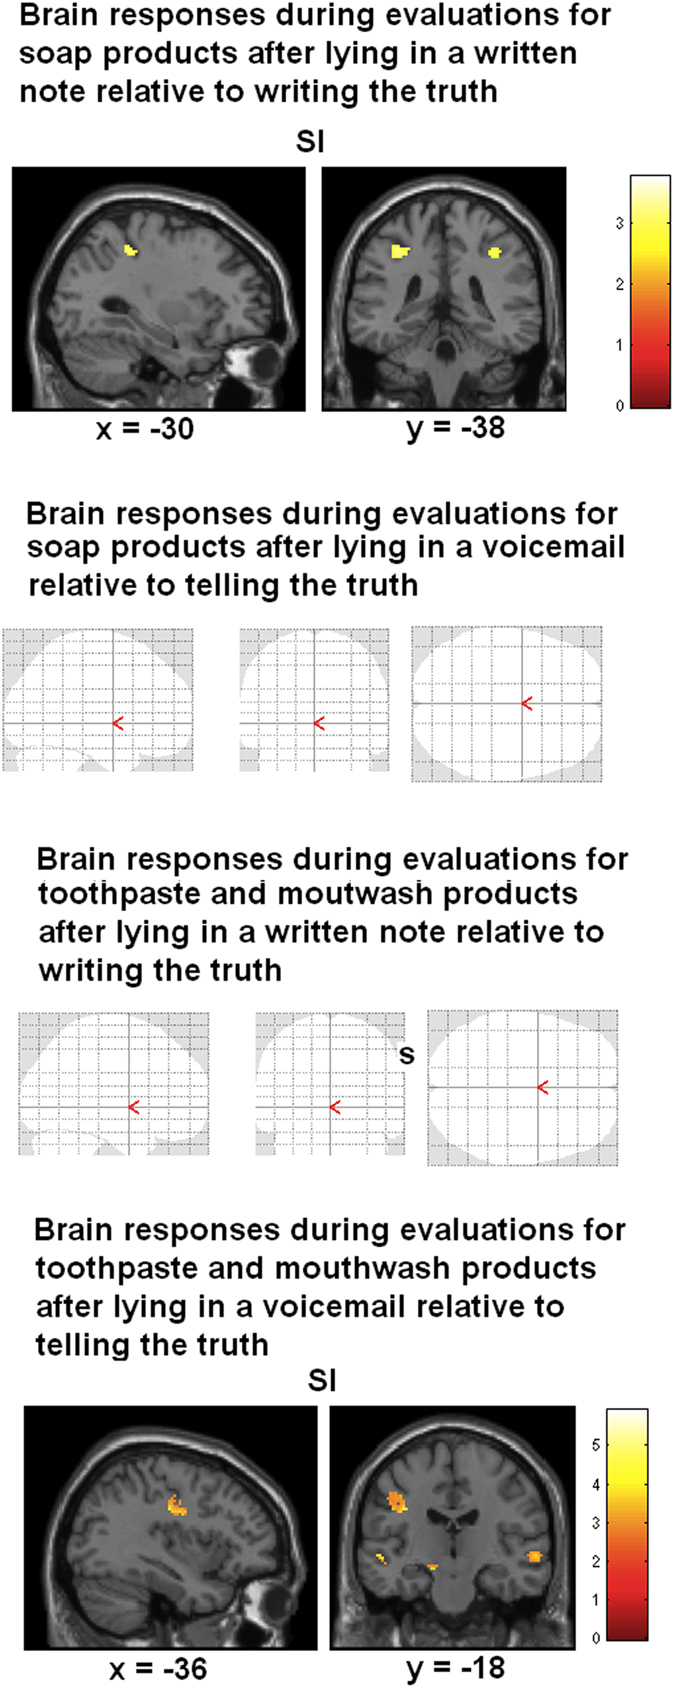
Figure 3. Statistical maps showing brain activation while participants had to evaluate hand soaps and toothpaste and mouthwash products.

See text for details. Areas of significant fMRI signal change are shown as color overlays on the T1-MNI reference brain (FWE corrected at p > 0.05).
