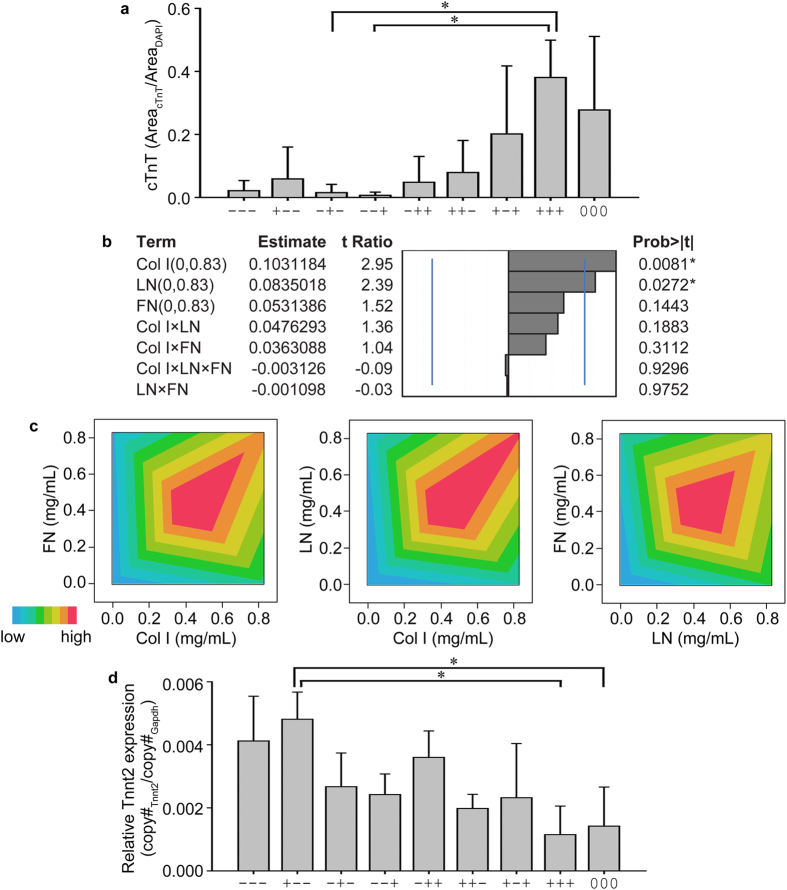
Figure 2. FEs inform the formulation space for three ECM proteins.
(a) A simple plot shows that multiple ECM proteins (detailed formulations in Table 1) promoted the expression of cTnT, compared to no ECM (−−−) or single ECM (+−−, −+−, or −−+). (b) Effect magnitudes of all main effects and interactions for the expression of cTnT (protein). Blue lines indicate significant probability values of 0.05. (c) Contour plots showing the interactions between FN and Col I, LN and Col I, and FN and LN. (d) ECM composites as delineated in Table 1 were also tested for the expression of Tnnt2 (gene). Results in (a,d), ANOVA Tukey’s HSD post hoc test, n = 3, *p < 0.05, mean ± S.D.

