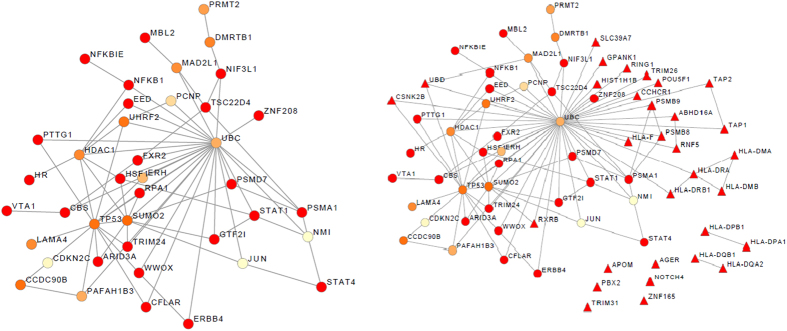
Figure 1.
(a) The subnetwork formed by identified module genes; (b) the subnetwork formed by sigMHC-genes and identified module genes. The triangle-shaped nodes represent sigMHC-genes and circular-shaped nodes represent DMS-identified module genes. The color of the node was proportioned with the gene P-value. The most significant gene P-value was red color and the most non-significant gene P-value was yellow color.

