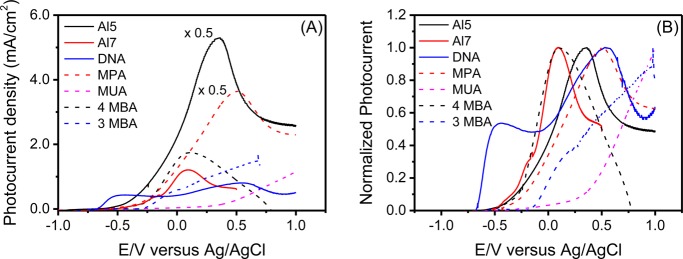
Figure 3.
(A) Photocurrent density as a function of the potential versus the Ag/AgCl electrode. (B) Normalized photocurrent density as a function of the potential versus the Ag/AgCl electrode. The normalization was performed by taking the highest current in the range to be 1. The potential was not corrected to present the effective overpotential. The solid and dashed lines present cells with chiral and achiral molecules, respectively.

