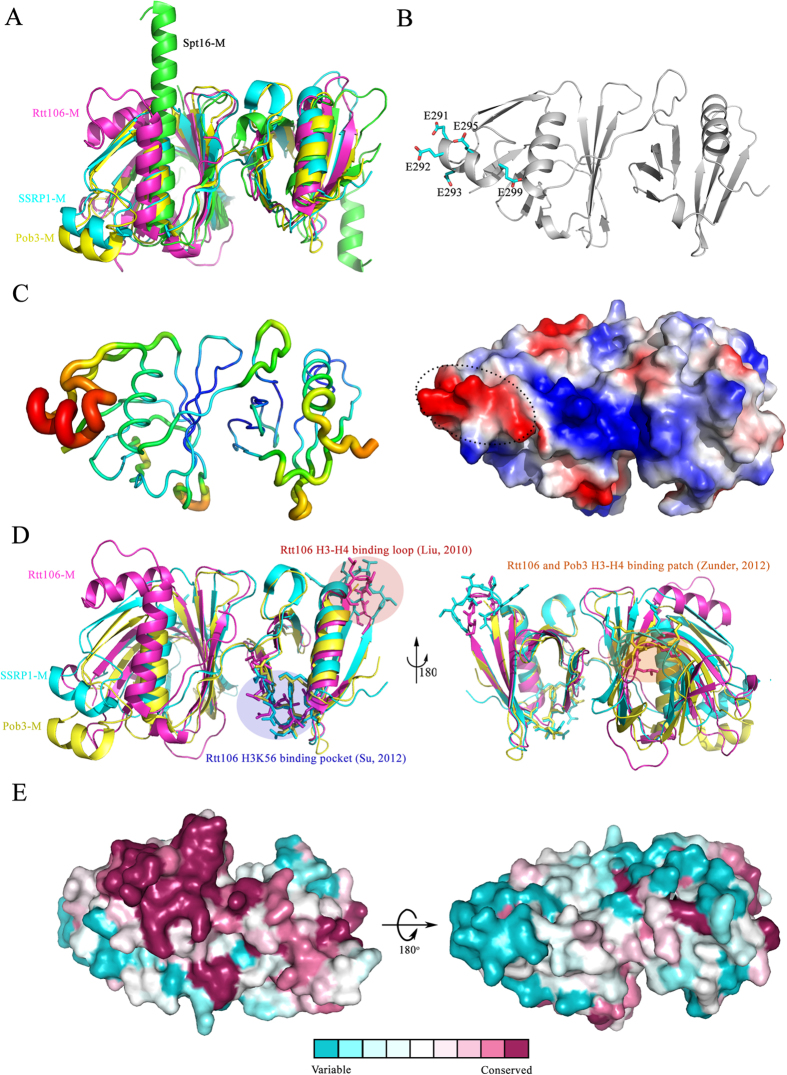
Figure 6. A structural comparison of SSRP1-M with other proteins adopting double PH domains and surface conservation analysis of SSRP1-M.
(A) The structural superposition of the tandem PH domains of SSRP1-M (cyan, PDB ID: 4IFS), Pob3-M (yellow, PDB ID: 2GCL; average r.m.s.d. of 1.52 Å on 225 Cα-atoms), Rtt106-M (magentas, PDB ID: 3GYP; average r.m.s.d. of 2.44 Å on 174 Cα-atoms), and Spt16-M (green, PDB ID: 4IOY; average r.m.s.d. of 2.55 Å on 178 Cα-atoms). (B) Upper panel: the acidic residues comprising the negatively charged region; Lower panel: the electronic potential surface of SSRP1-M with the unique negatively charged region labelled. (C) The B-factor distribution of SSRP1-M. The wider and redder tubing indicates higher B-factor. (D) The structural superposition of SSRP1-M (PDB ID: 4IFS), Pob3-M (PDB ID: 2GCL) and Rtt106-M (PDB ID: 3GYP). The reported histone binding surfaces of Pob3 and Rtt106 are indicated. (E) The surface conservation analysis of SSRP1-M. The orientations are kept the same as Fig. 2E.

