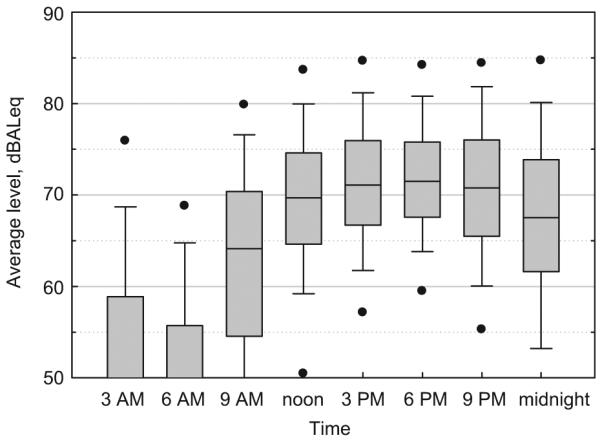
Figure 4.

Distributions of equivalent continuous levels by time of day. Shaded regions represent the interquartile range, with the median represented by the solid line within the shaded area. Error bars represent the 20th and 80th percentile points, and the filled circles represent the 5th and 95th percentiles.
