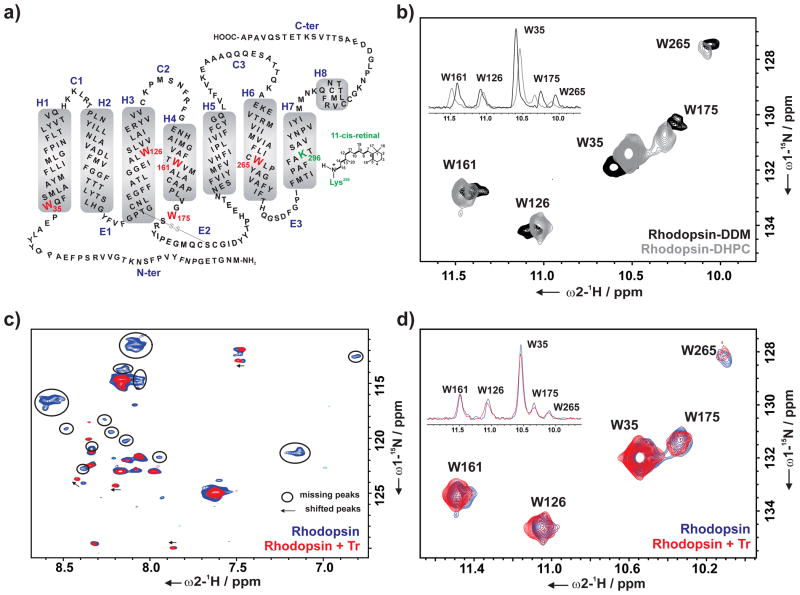
Figure 2.
a) Schematic representation of the secondary structure of bovine rhodopsin with the five tryptophan residues (W35, W126, W161, W175, and W265) used as reporter groups in the NMR experiments. b) Overlay of the indole region of 2D 1H, 15N SOFAST-HMQC spectra of α,ε-15N-tryptophan-labeled rhodopsin in DDM (black) and DHPC (gray) micelle. Overlay of 2D 1H, 15N SOFAST-HMQC spectra of α,ε-15N-tryptophan-labeled rhodopsin without (blue) and with Tr (red) (rhodopsin : Tr – 1 : 2) showing c) backbone region, d) indole region of the spectra. Overlay of 1D projection of the corresponding cross peaks of the indole region of 2D spectra is shown in inset (b and d). All spectra were recorded at 800 MHz (T = 298 K) in the following buffer: DDM spectrum – 20 mM sodium phosphate buffer pH 7.4; DHPC spectra – 25 mM Tris pH 7.5, 100 mM NaCl, 0.1 μM EDTA, 10% D2O and 1 mM 3-(trimethylsilyl)-2,2′,3,3′-tetradeuteropropionic acid (TSP-d4).

