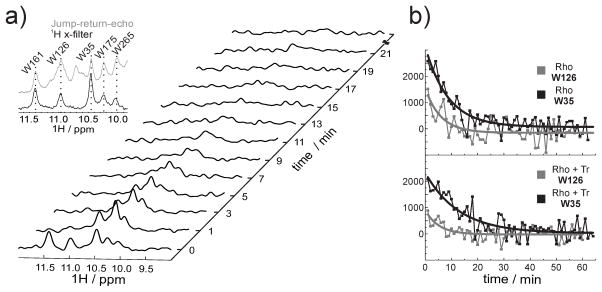
Figure 3.
NMR kinetics. a) A series of 1D 1H NMR spectra of α,ε-15N-tryptophan-labeled rhodopsin recorded at different time intervals after illumination. The indole region of the spectrum is shown. The five resonances visible in the dark state correspond to the five tryptophan residues present in rhodopsin. Subsequent to illumination, 1D 1H spectra were recorded with a temporal resolution of one minute. Inset: overlay of spectrum of the jump-return-echo (gray) and 1H x-filter (black) NMR experiment of rhodopsin samples. The dashed lines connect the corresponding resonances of the five tryptophan residues. b) Extracted signal intensities from the series of 1D 1H NMR spectra of α,ε-15N-tryptophan-labeled rhodopsin in presence and absence of Tr. A mono-exponential fit was applied for the signal intensities of W35 (black curve) and W126 (gray curve).

