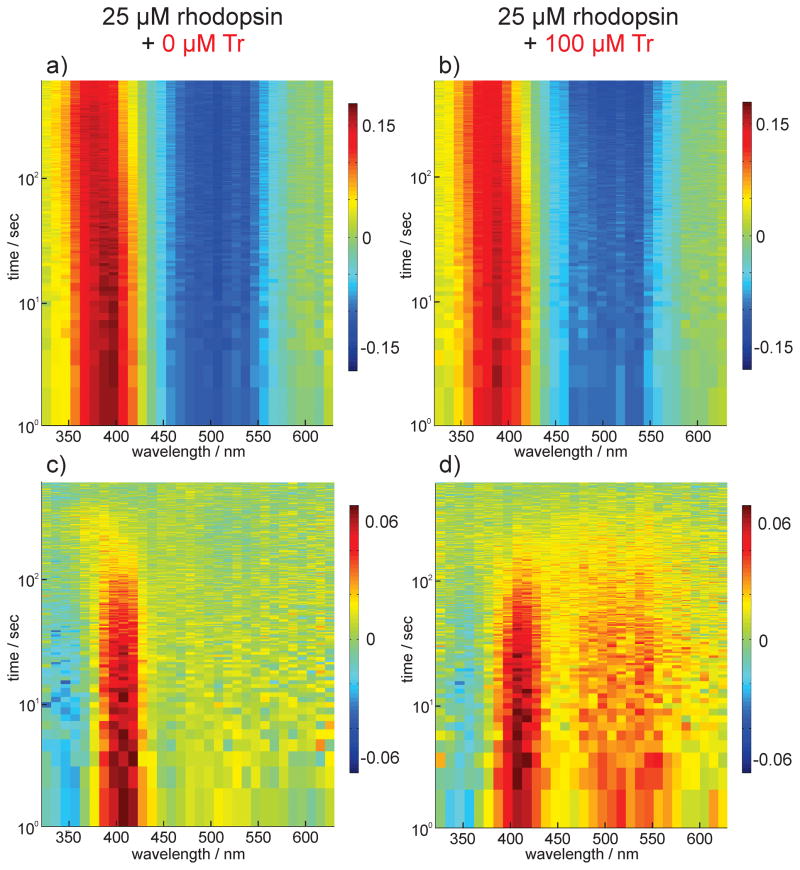
Figure 4.
Transient absorption spectra of rhodopsin a) without and b) with Tr. Red is positive and blue is negative change in absorption. Double difference spectra of a) and b) calculated by subtracting the absorption change recorded at the maximum delay time from the transient absorption data are depicted in c) and d) respectively.

