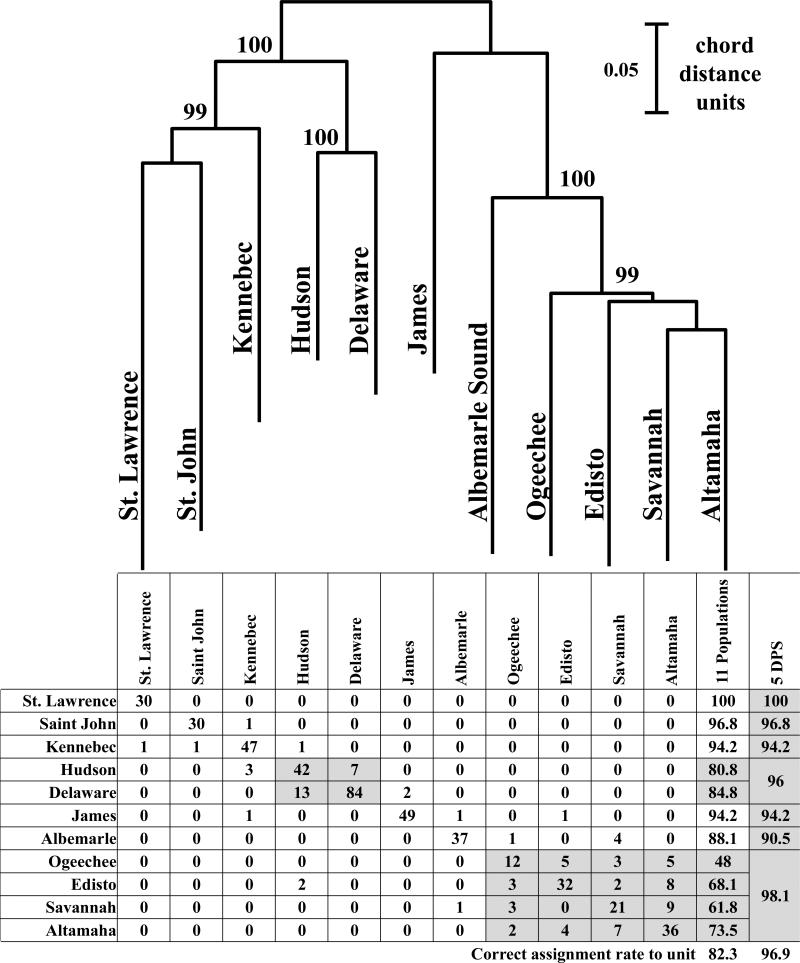
Fig. 2.
(a) Neighbor-Joining Tree depicting evolutionary relationships (as Cavalli-Sforza and Edwards chord distances) among the eleven A. oxyrinchus reference spawning populations that were surveyed at 11 microsatellite loci in this study. Numbers represent bootstrap support at each branch with 5,000 replicates of resampling across loci.
(b) Results of assignment testing of the baseline individuals from the eleven A oxyrinchus reference spawning populations using 11 microsatellite loci and mtDNA control region haplotypes (scored as a homozygous locus) to determine the likelihood of each individual's multi-locus genotype/haplotype being found in the reference collection and DPS from which it was collected (without replacement) using the program GeneClass2. The numbers in the shaded cells represent the total number of individual specimens from the populations in that DPS correctly assigned to DPS.

