Figure 6.
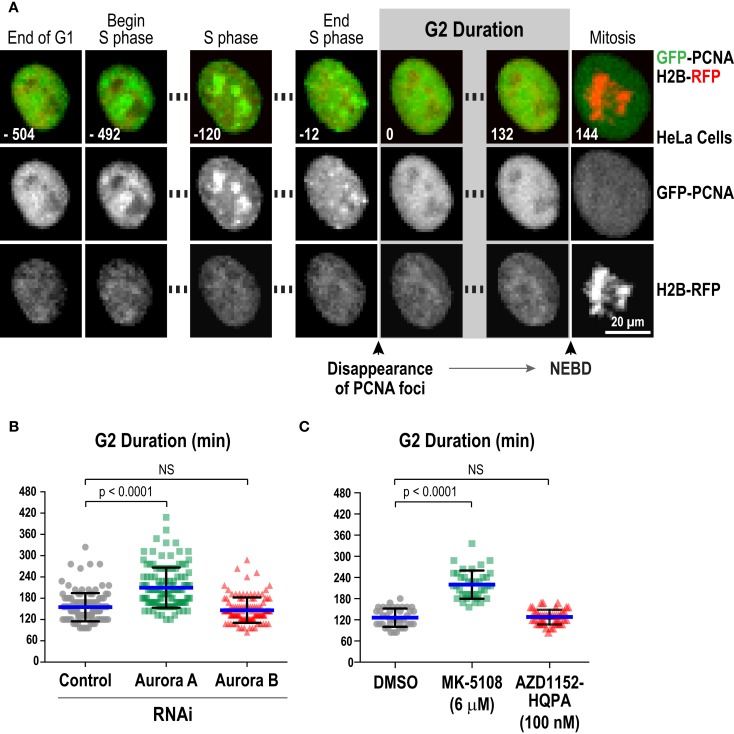
Measurement of G2 duration provides a specific readout for Aurora A kinase activity. (A) Images from a timelapse sequence of HeLa cells stably expressing GFP-PCNA; H2B-RFP. Gray scale images for the two separate channels are located below each colored merge. G2 duration is measured as the time from dissolution of PCNA foci to nuclear envelope breakdown (NEBD). See also Movie S1 in Supplementary Material.(B) Analysis of G2 duration in HeLa cells following knockdown of Aurora A or Aurora B by RNAi. Blue lines indicate the mean; black error bars are the SD. p-values are from unpaired t-tests. (C) Analysis of G2 duration in HeLa cells using selective Aurora A versus Aurora B inhibition, with MK-5108 (6 μM) and AZD1152-HQPA (100 nM), respectively. Blue lines indicate the mean; black error bars are the SD. p-values are from unpaired t-tests.

