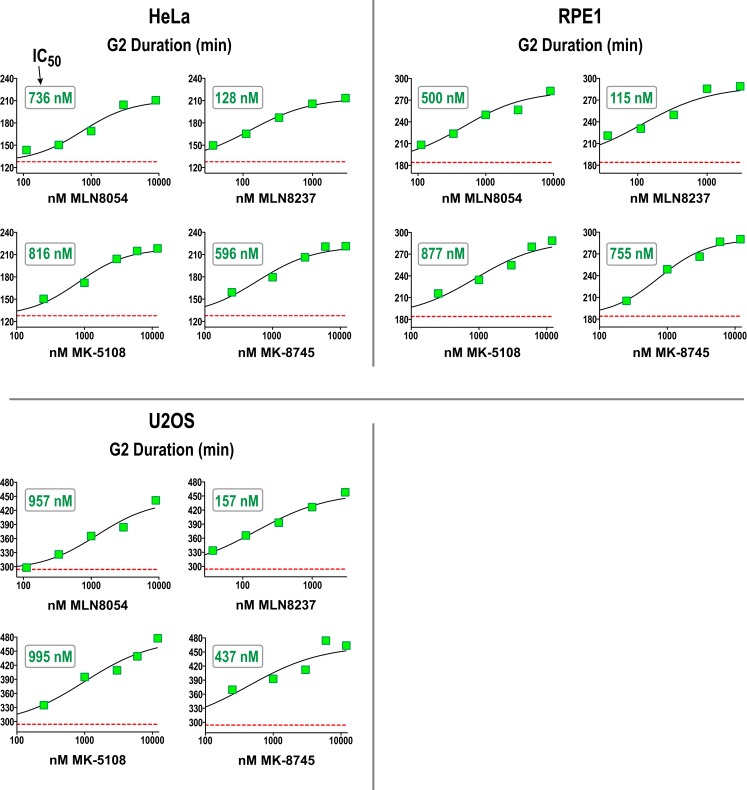
Figure 7.
Dose–response analysis of G2 duration with inhibitors specifically targeting Aurora A in 3 cell lines. G2 duration (in minutes), measured as in Figure 6, for the indicated inhibitors and cell lines. Each point represents the mean of 40–100 cells from two sets of measurements. See Figure S4 in Supplementary Material for scatter plots showing all measurements. IC50 values shown on the graphs were determined by computing dose–response curves using a four-parameter, variable slope fit in GraphPad Prism.

