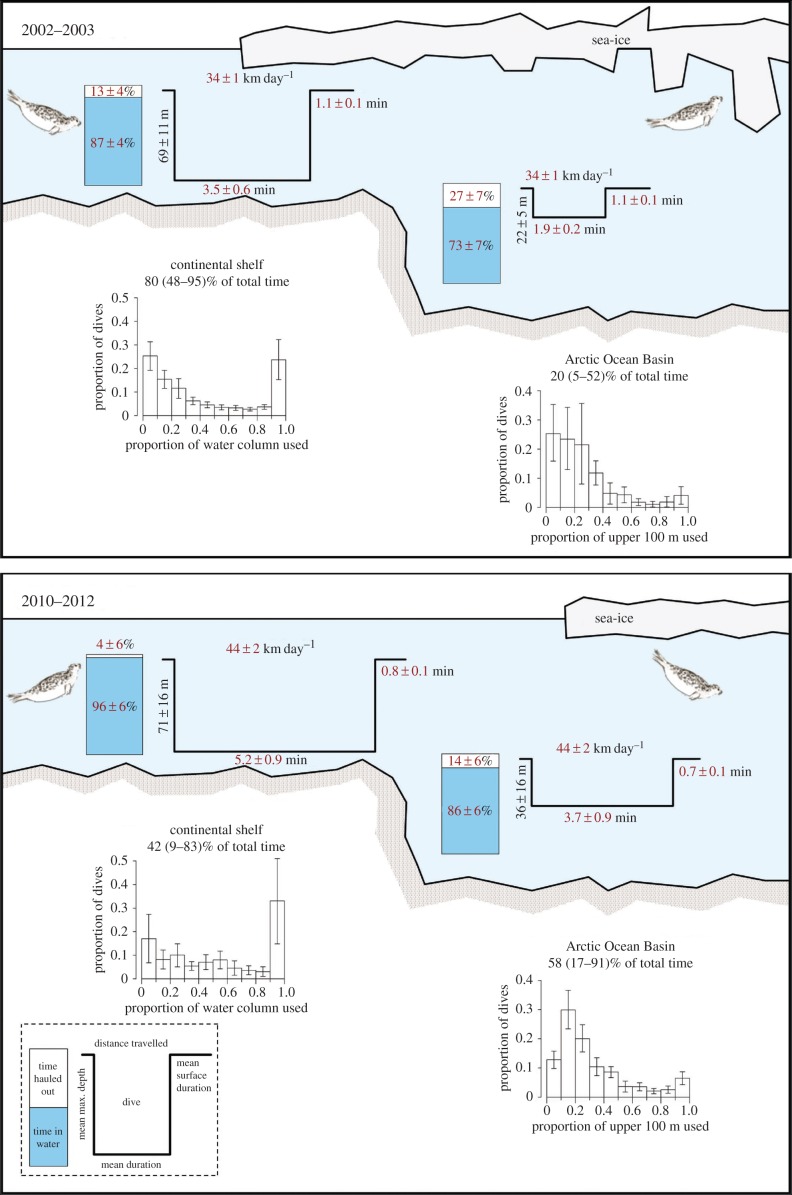
Figure 2.
Behaviour metrics for ringed seals in Svalbard, Norway, during offshore trips in 2002–2003 and 2010–2012. Values in red indicate significant differences between the two time periods. Barplots over the Arctic Ocean Basin only consider the upper 100 m of the water column. Error bars in the graphs indicate 95% confidence intervals.

