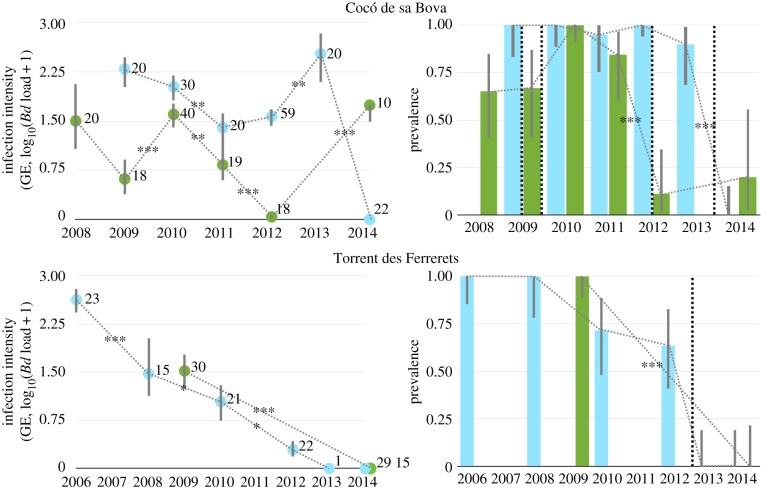
Figure 1.
Infection intensity (left panels; mean±95% CI by the bias-corrected and accelerated BCa method with 2000 bootstrap replications) and prevalence (on the right; mean±95% Clopper–Pearson CI) over two pond sites at the Cocó de sa Bova (combined in top panels) and three at the Torrent des Ferrerets (combined in bottom panels), over the course of the study. Blue (light colour) shows values derived from spring sampling, green (darker colour) for summer. Pairwise comparisons (Wilcoxon signed-rank tests for infection intensities and Fisher exact tests for prevalence) are represented by dashed lines and significant differences represented with asterisks (*p < 0.05, **p < 0.01 and ***p < 0.001) after a sequential Bonferroni adjustment. Sample sizes are shown in left panels. Dashed vertical lines in right panels indicate when treatments were implemented. (Online version in colour.)

