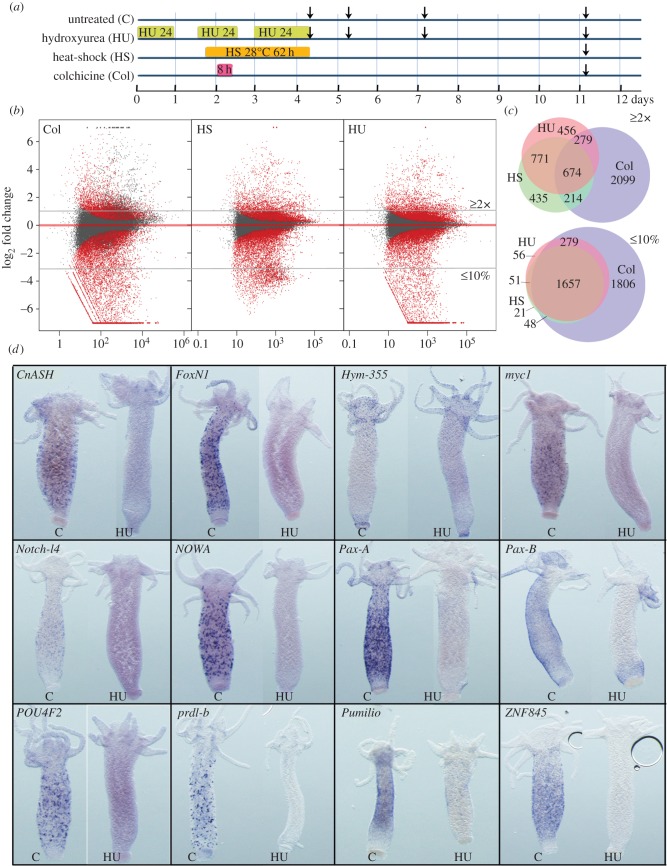
Figure 3.
Modulations in gene expression upon loss of neurogenesis. (a) Timelines showing the design of the control and HU/HS/Col treatments. Vertical arrows indicate the days when body columns were dissected for RNA preparation. (b) MA plot of RNA-seq data 7 days after colchicine, HS or HU treatment ending. Each dot corresponds to a given transcript and red dots correspond to transcripts with significant fold change in treated versus untreated animals (p ≤ 0.05). x-axis average expression level (normalized number of reads), y-axis log2(fold change). (c) Venn diagrams representing the number of genes either up-regulated over 2× (upper panel), or down-regulated by more than 90% (lower panel) at day 11 after HU, HS, or Col treatments. Note that Col exposed animals up-regulate a specific subset of 2099 genes, distinct from the 674 genes found up-regulated in all three types of treatment. (d) Expression patterns of predicted or tested NG genes in untreated (c) or HU-treated (HU) intact animals as in figure 2a: the neuropeptide Hym-355, the receptor Notch-l4, the RNA-binding protein Pumilio, the TFs CnASH, FoxN1, myc1, Pax-A, Pax-B, POU4F2, Prdl-b, ZNF845 and the nematocyte-specific Cys-rich NOWA gene. Note the complete loss of expression of all genes 7 days after HU, except Hym-355.

