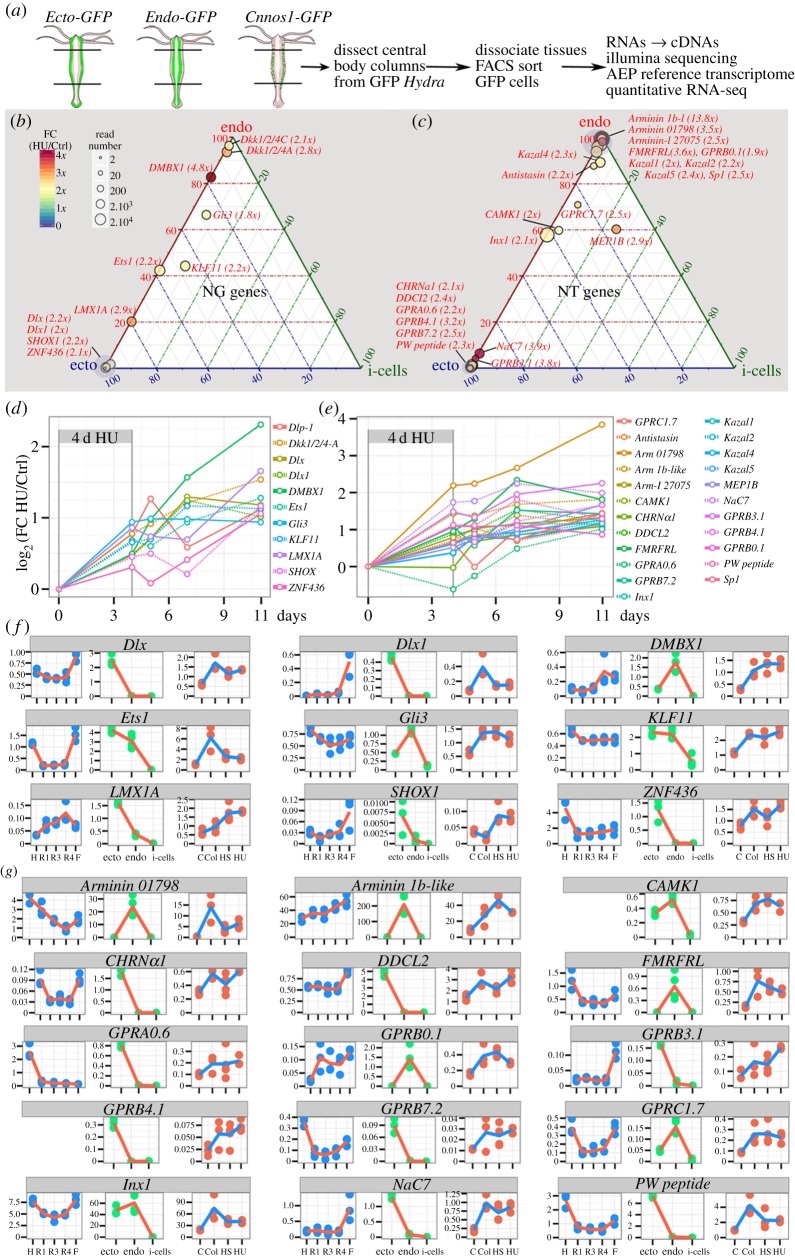
Figure 5.
NT and NG genes up-regulated upon HU-induced loss of neurogenesis. (a) Scheme depicting the FACS-assisted production of cell-type-specific RNA-seq quantitative transcriptomics, ectodermal epithelial from Ecto-GFP [29], endodermal epithelial from Endo-GFP [30] and interstitial from Cnnos1-GFP [31]. (b,c) Ternary plots showing the results of the quantitative cross analysis of the cell-type RNA-seq datasets in homeostatic Hv_AEP (position within the plot) and the HU-treated RNA-seq datasets performed on Hv_Sf1 to detect neurogenic (b) and neurotransmission (c) genes up-regulated at least twofold 7 days post HU exposure. Circle surfaces are proportional to the number of reads (see electronic supplementary material, table S1, for absolute read numbers). The fold change (FC) HU over control is given by the colour code and indicated next to gene names. (d,e) Kinetics of HU-induced up-regulation of 34 genes presumably involved in neurogenesis (d), through transcriptional regulation (Dlx, Dlx1, DMBX1, Ets1, KLF11, LMX1A, ZNF436, Gli3, SHOX1) and/or Wnt signalling inhibition (Dkk1/2/4A, Dkk1/2/4C), or neurotransmission (e), possibly neuropeptidic (NaC7, FMRFRL), epitheliopeptidic (Arminin 1b-l, Arminin 01798, PW peptide pre-prohormone), dopaminergic (DOPA decarboxylase l2—DDCL2), cholinergic (CHRNα1), or uncharacterized (GPRA0.6, GPRB0.1, GPRB3.1, GPRB4.1, GPRB7.2) (e). All values at time 0 (before treatment initiation) were extrapolated to be equal to 0. (f,g) RNA-seq profiles of 9 NG and 15 NT genes up-regulated upon loss of neurogenesis. Three types of information are presented: spatial (see figure 1b), cell-type distribution (see a) and responses to Col/HS/HU treatment (see figure 2a). y-axis: thousands of mapped reads.

