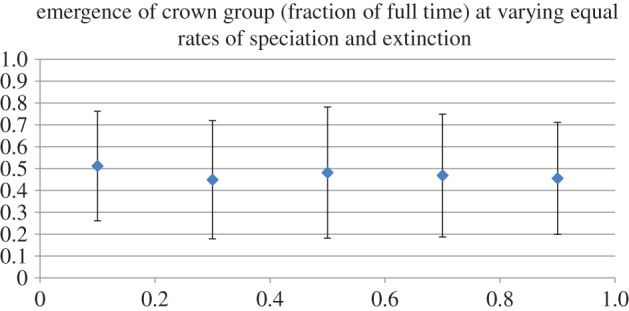
Figure 2.

Results of simulations of varying speciation (S) and extinction (E) rates where S = E (i.e. where diversification rate (D) = 0): error bars = ±2 s.d. y-axis represents fraction of total time at which crown group arises; x-axis represents S/E.
