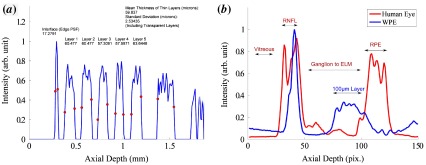
Figure 10.
(a) Normalised intensity profile for the processed A-scan from Figure 8 (a). The red dots denote segmentation at the point of maximal intensity gradient. The intensity drops to zero for the transparent layers because the processed image has been thresholded to minimise noise. (b) The mean intensity across a B-Scan of both a human retina and a revision of Target B containing only layers, acquired from the spectrometer without image enhancement. (The colour version of this figure is included in the online version of the journal.)

